
AWS DevOps + Databricks
At its core, Databricks is a data and AI platform that reads large amounts of data, processes and transforms it, and outputs useful results.
Visit my Github repo for this project:
https://github.com/franciscojavierguardado101/aws-govt-data-pipeline-/actions/runs/33300537841
https://github.com/franciscojavierguardado101/aws-govt-data-pipeline-
When setting up an account, the first thing I do is go to "Billing" to set up billing alarms so AWS does not chanrge me unexpectedly.
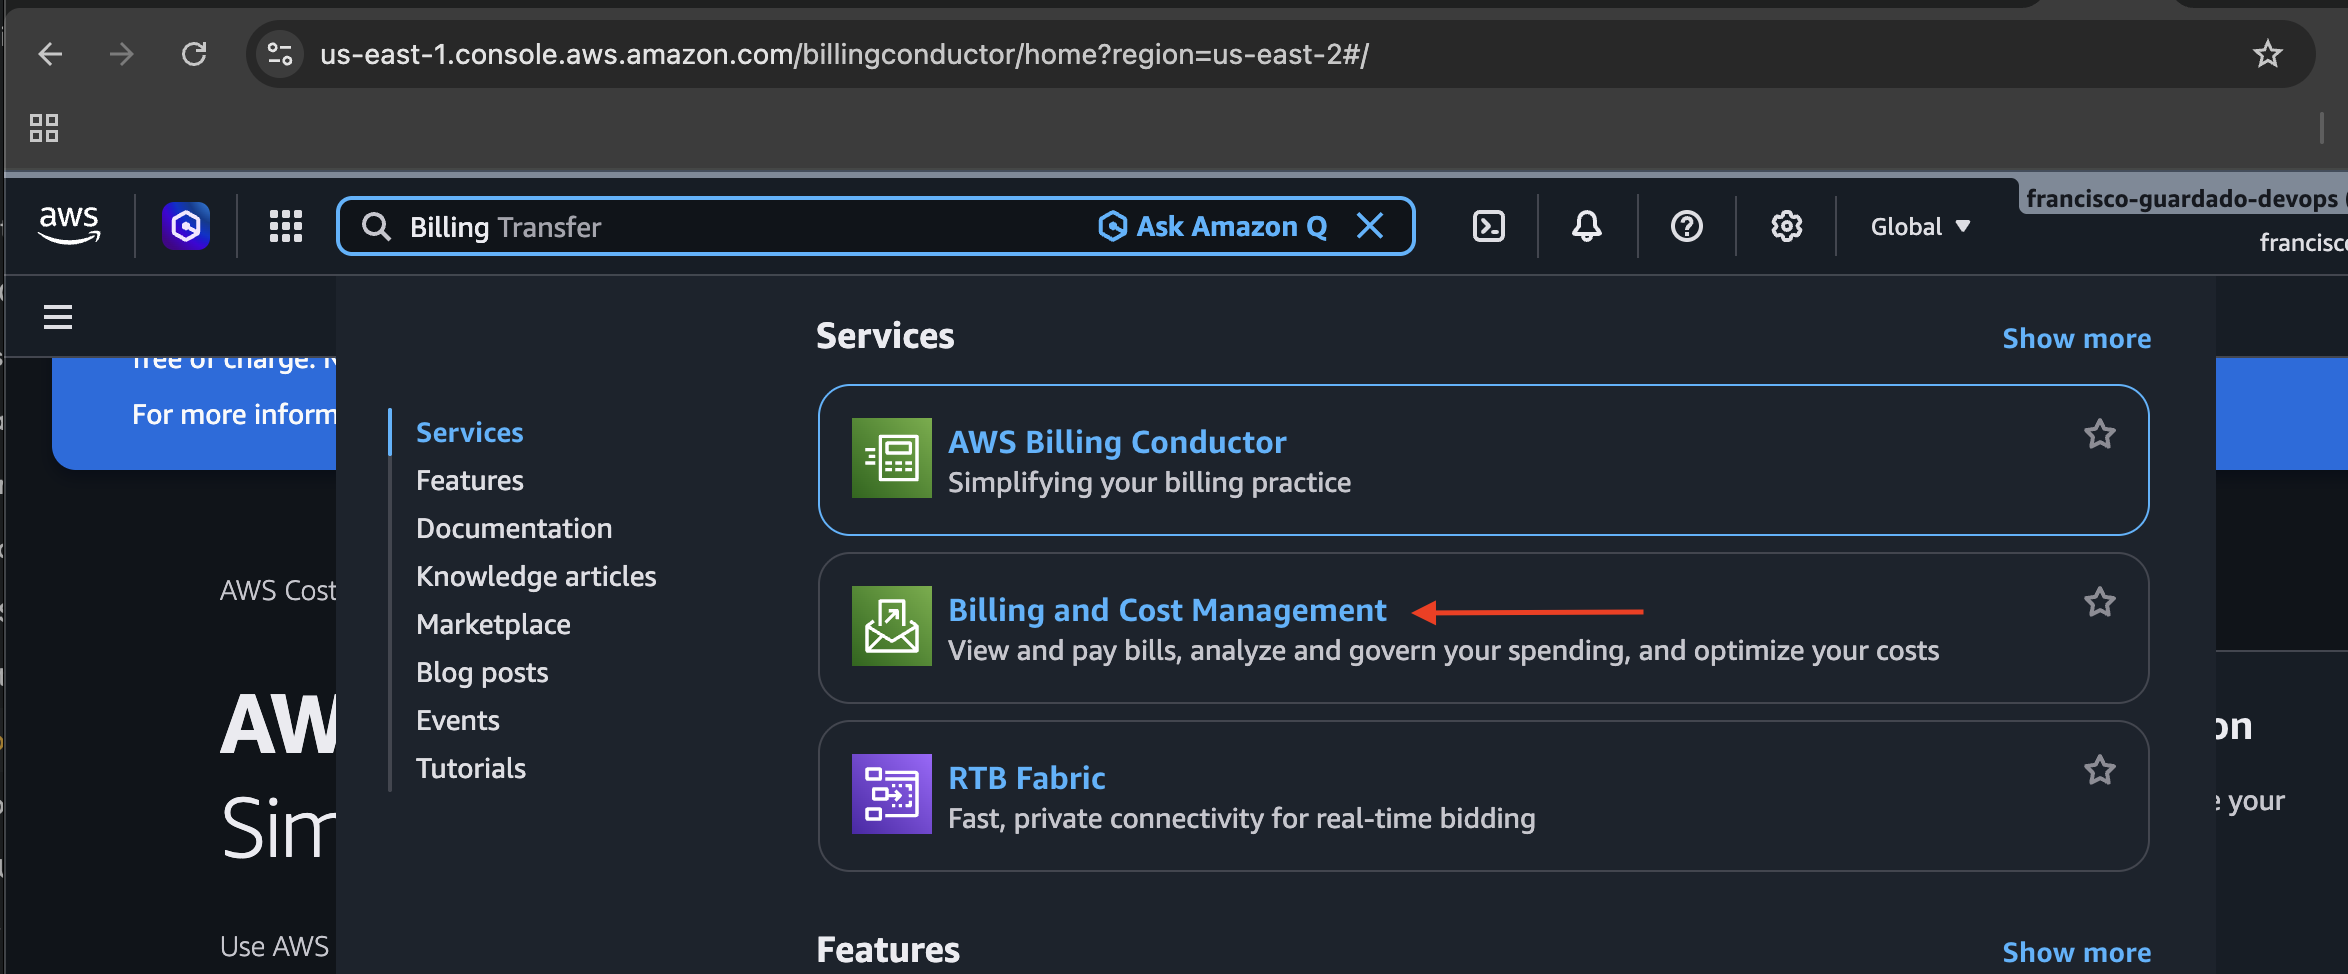
Go to the search bar, type in Billing and then click on Billing and Cost Management as seen on the screenshot below:
Make sure to go to Billing and Cost Management > Budgets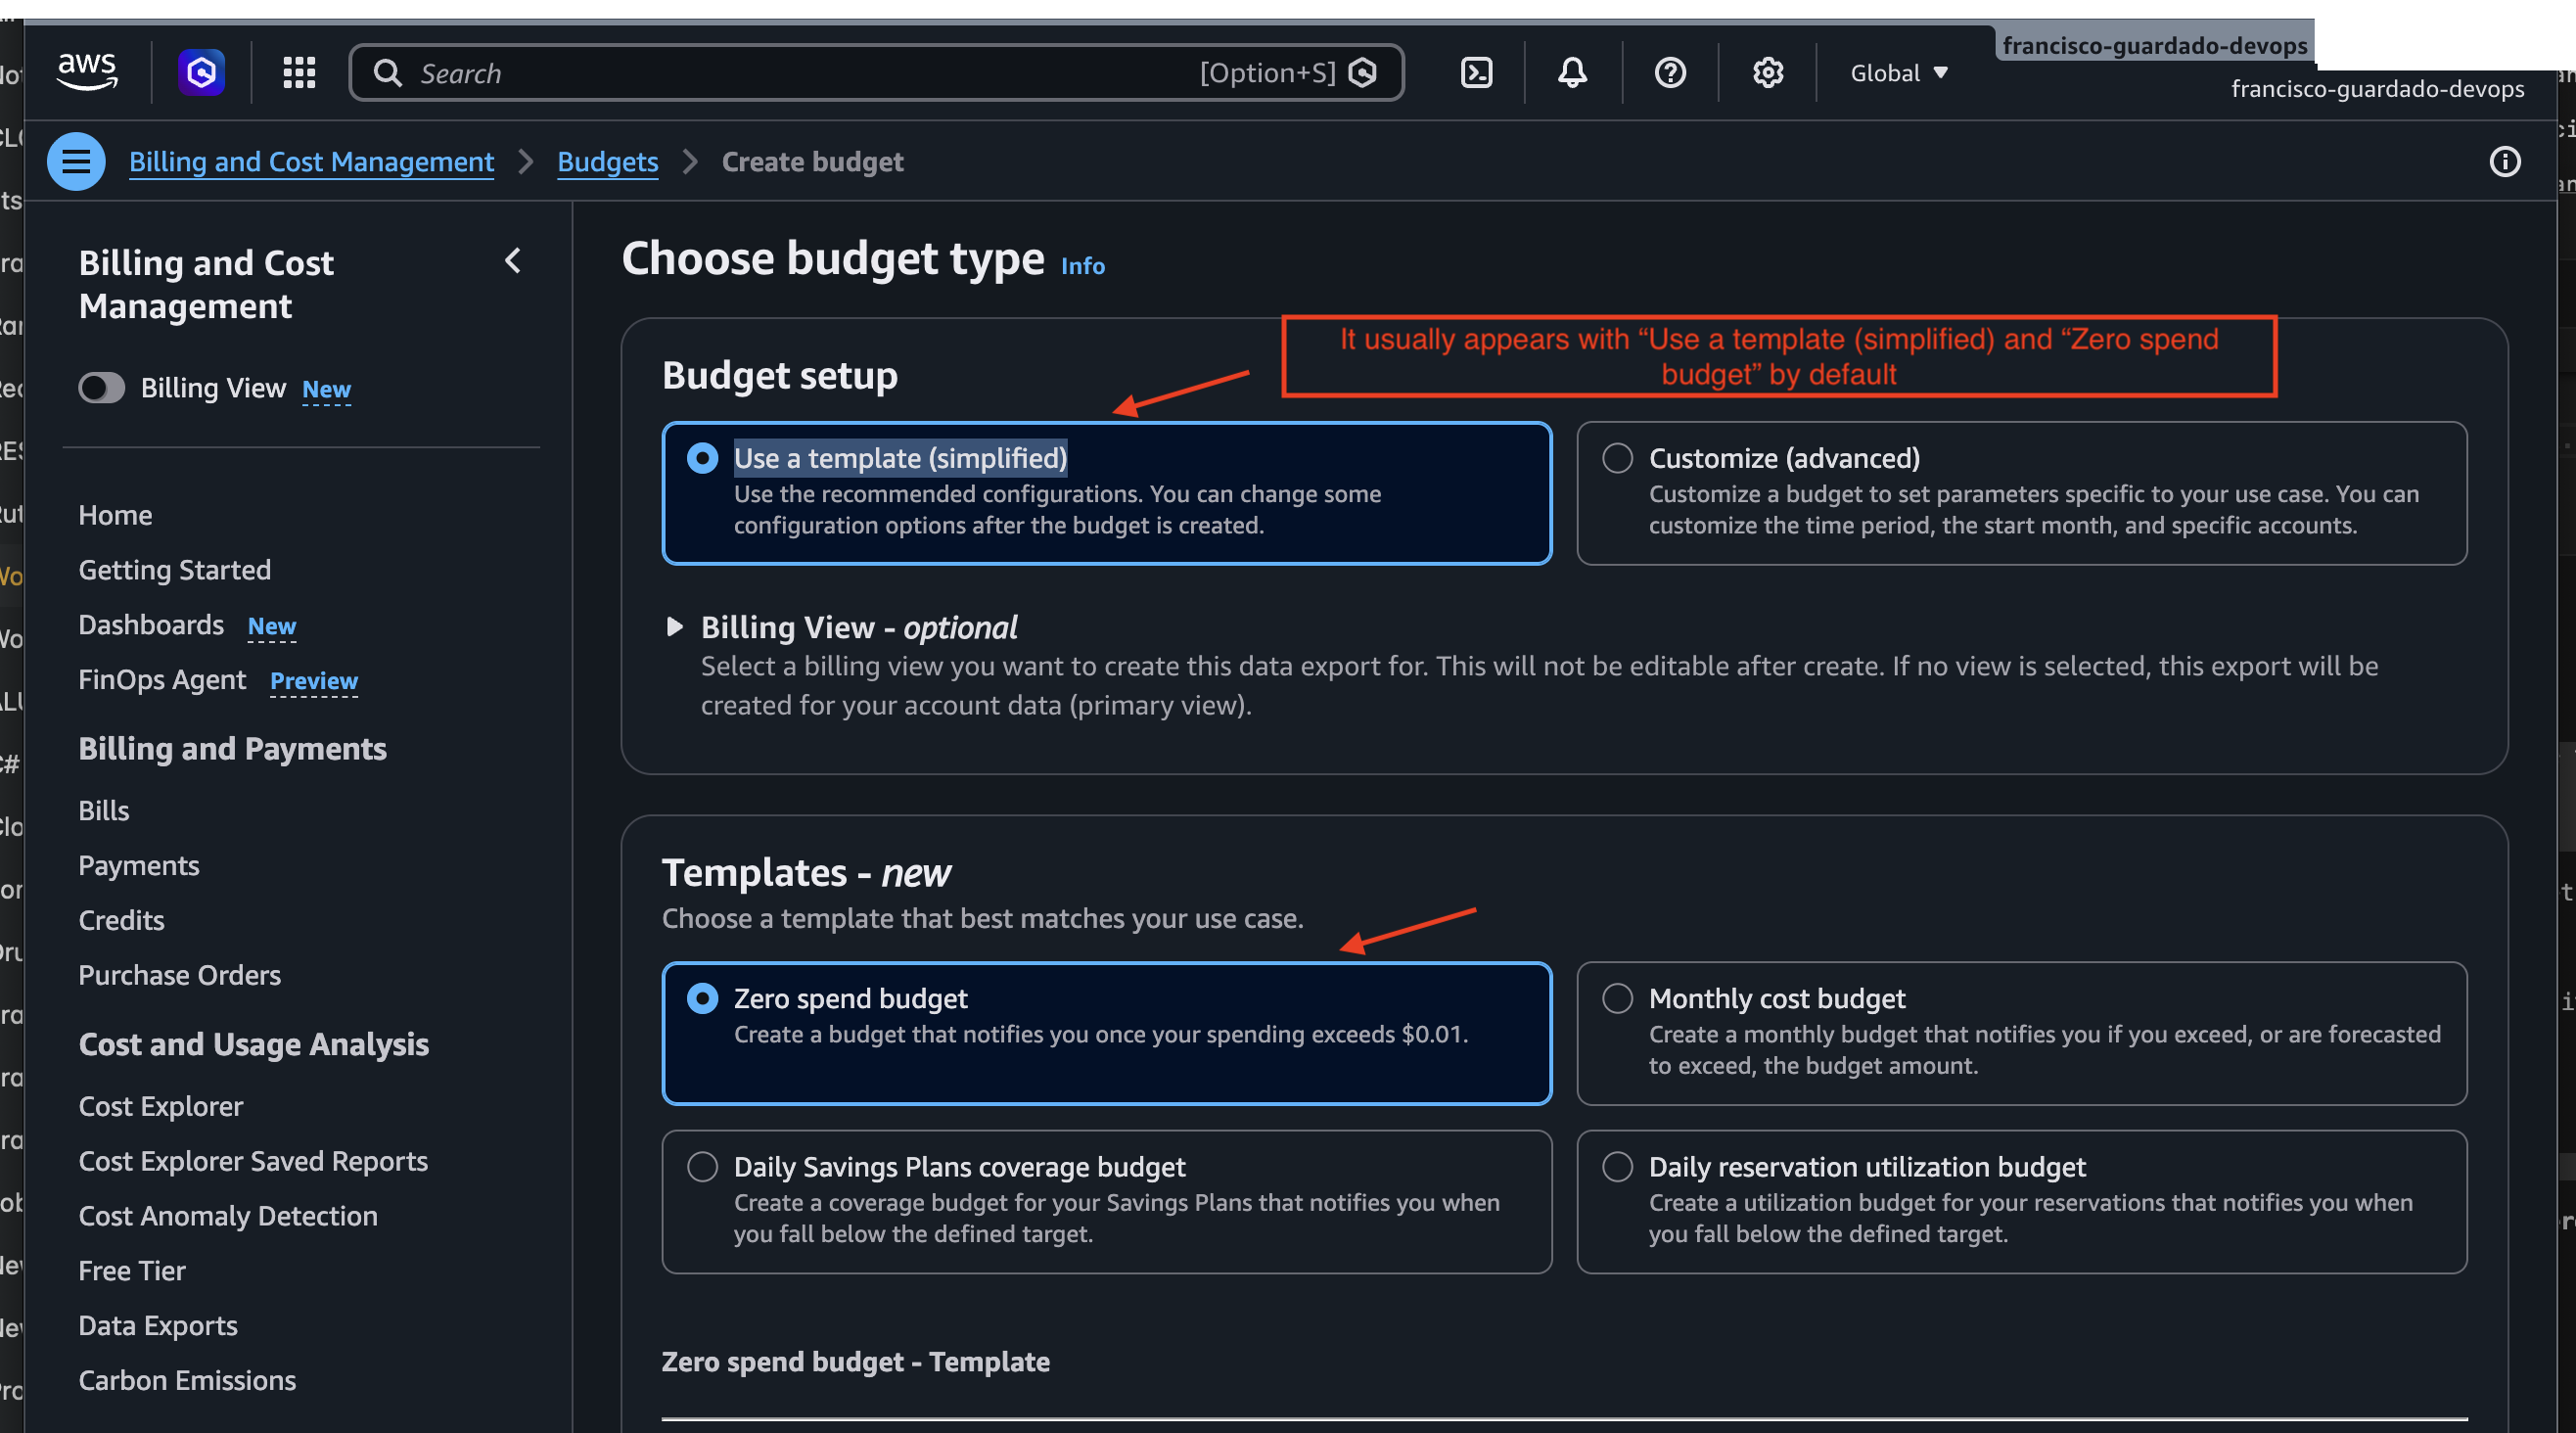
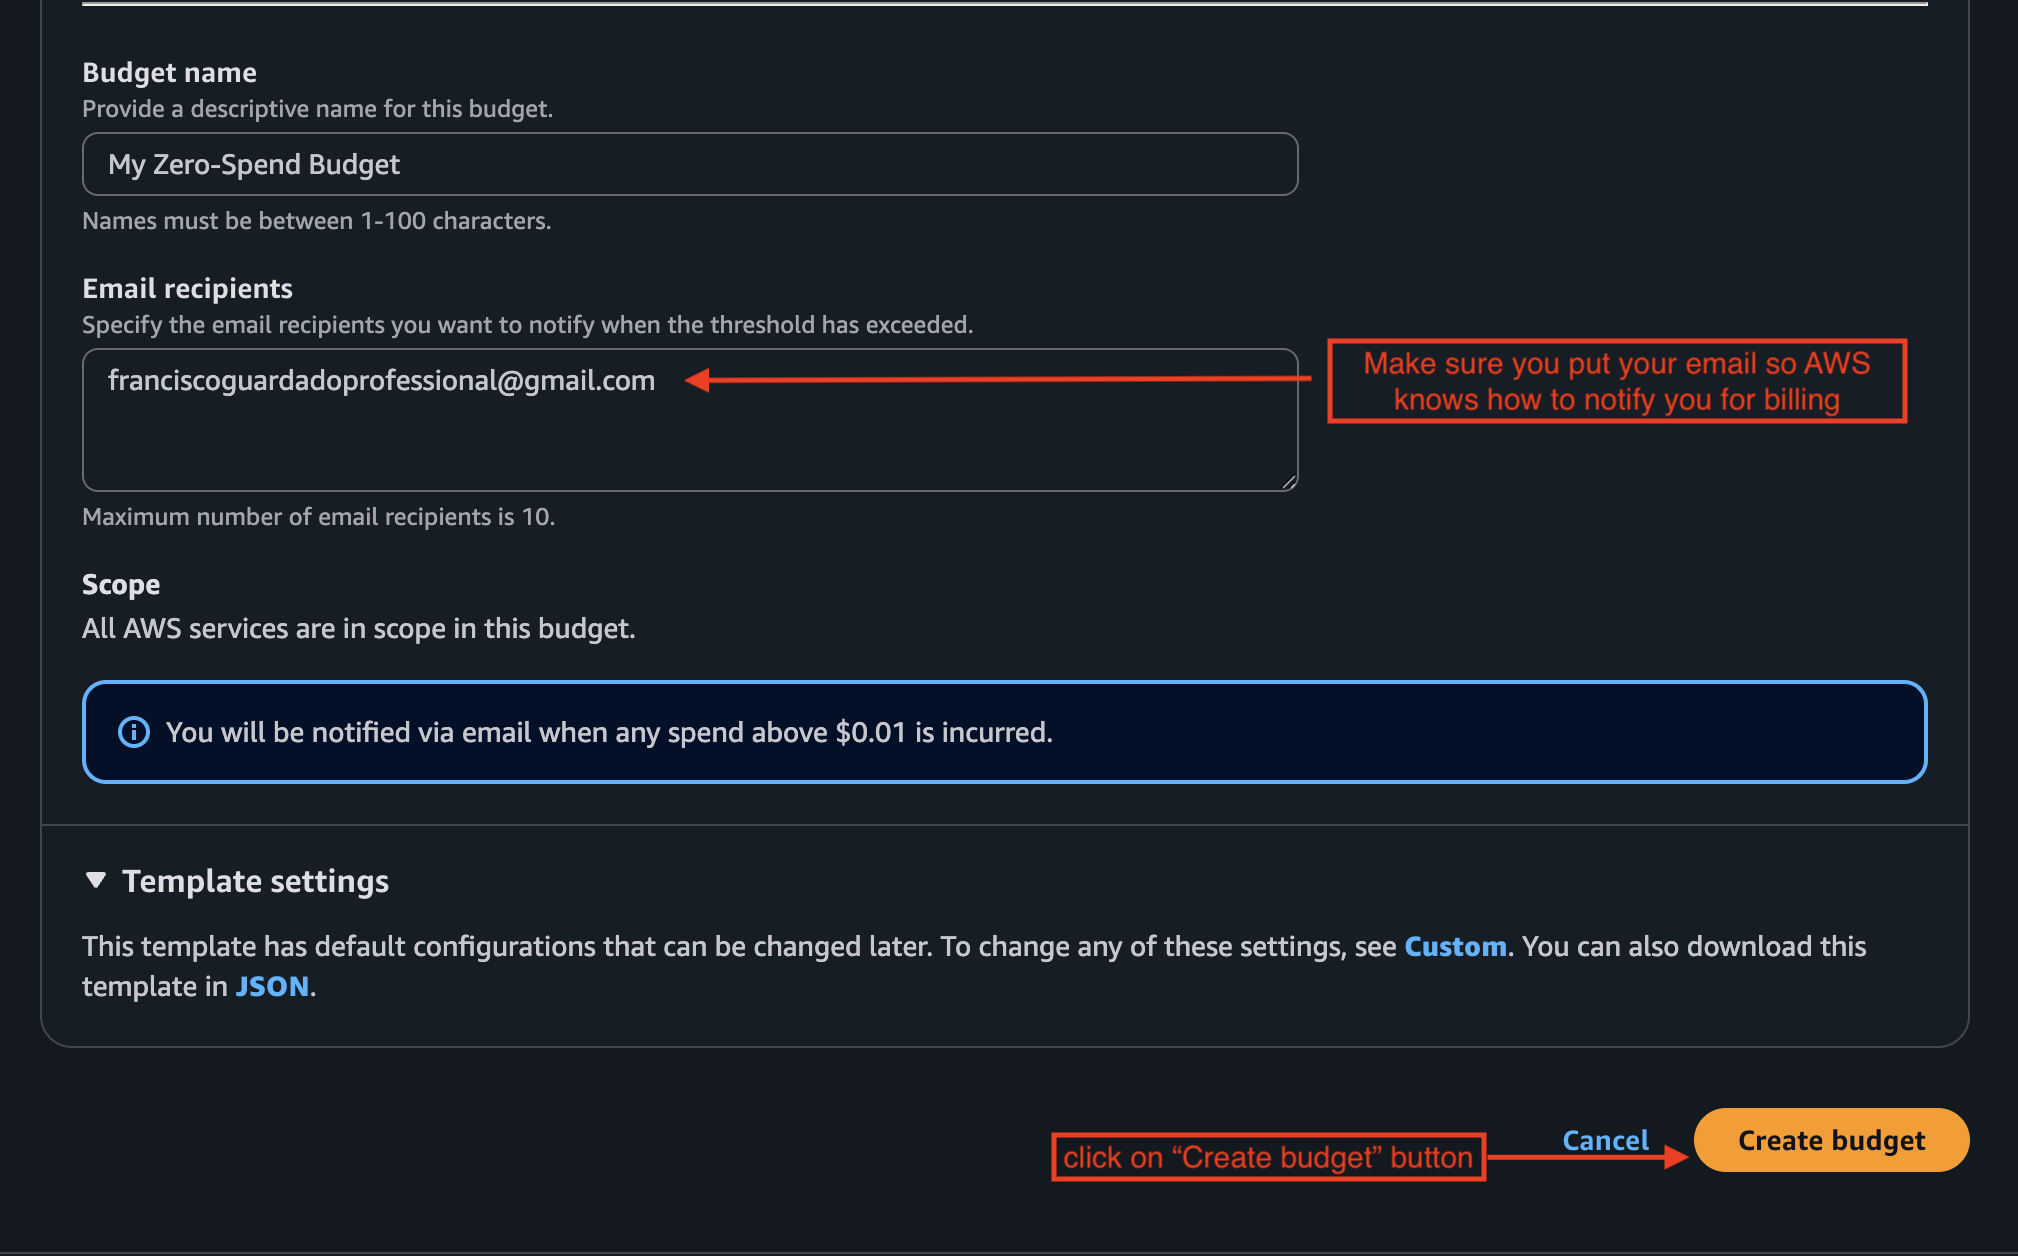
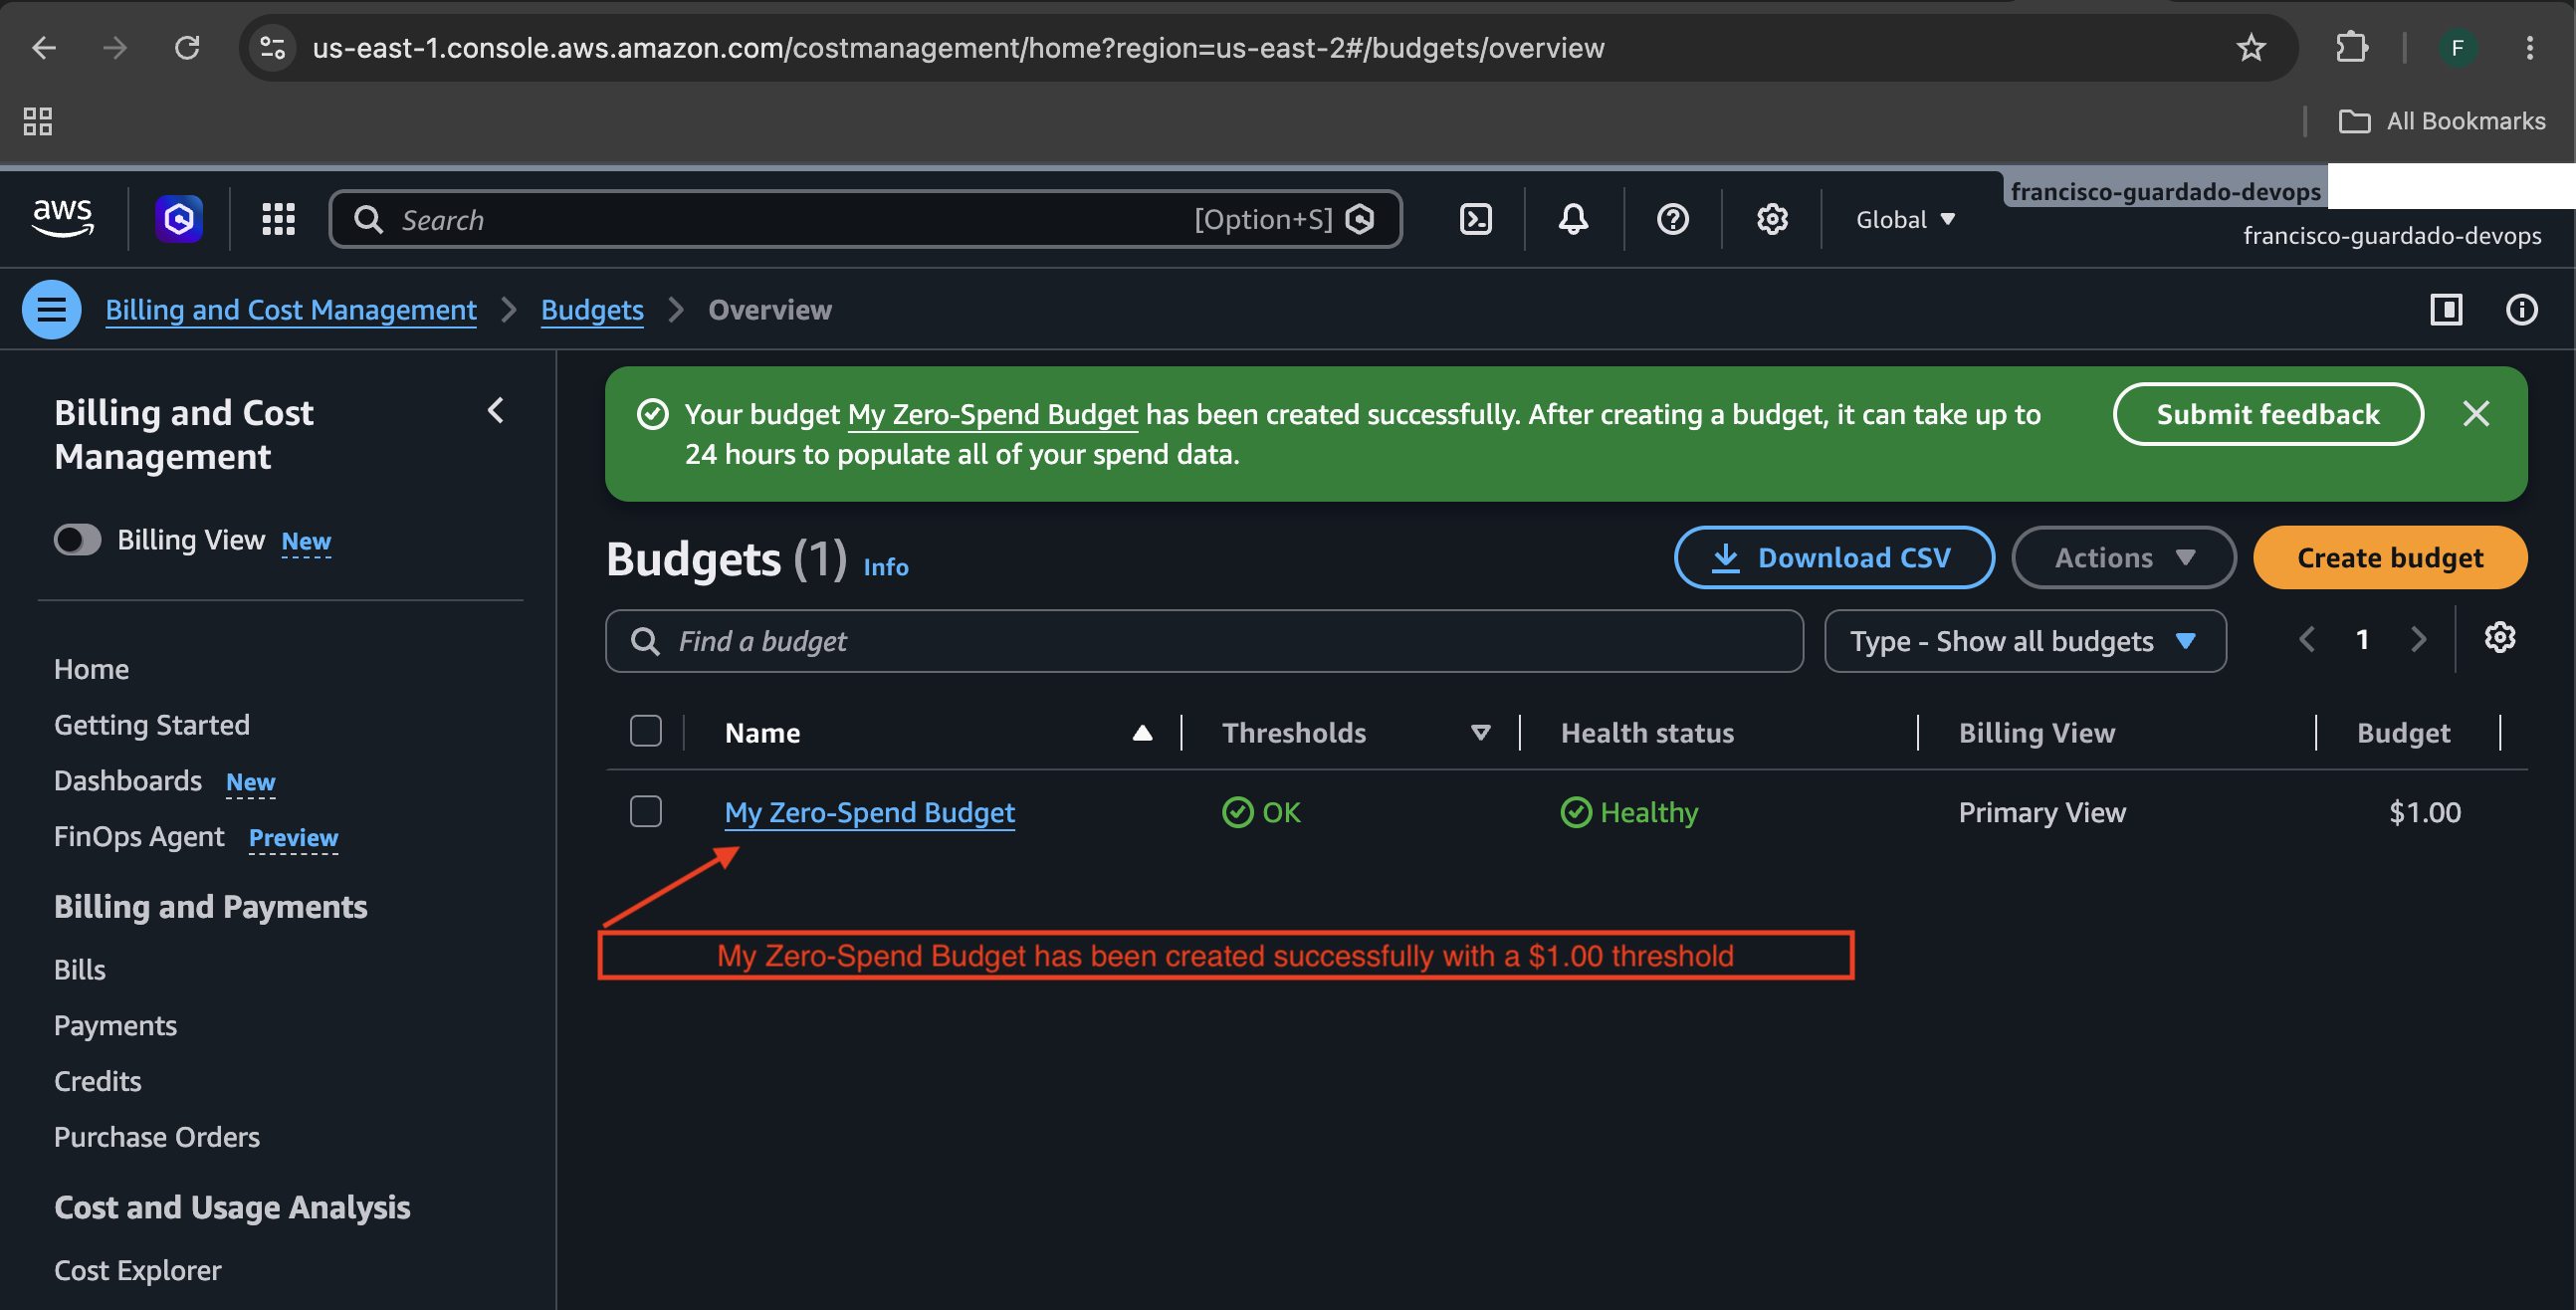
On my screenshot above demonstrate how My Zero-Spend Budget was created successfully with a $1.00 threshold
AWS will send an email alert the moment any charge occurs on the account
This is a best practice for any AWS environment which is especially important in government and enterprise settings where cost governance is required
S3
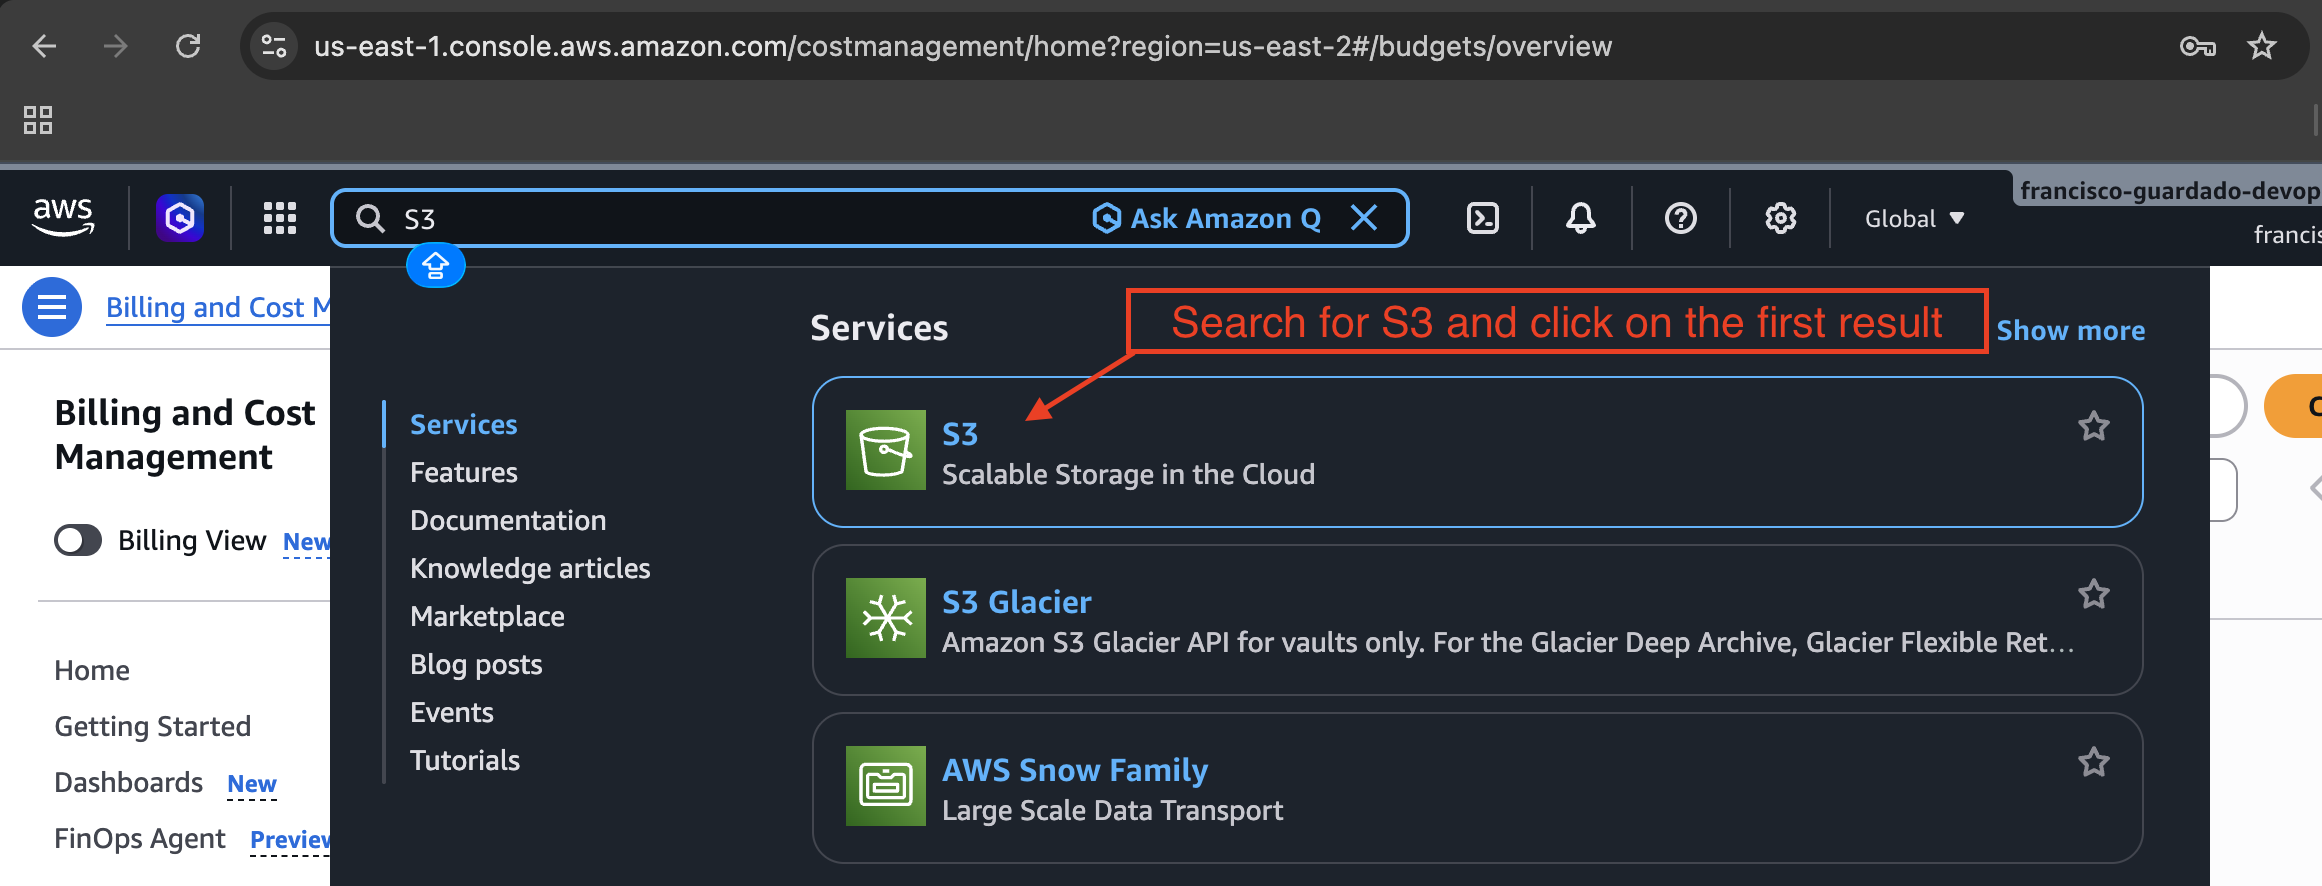
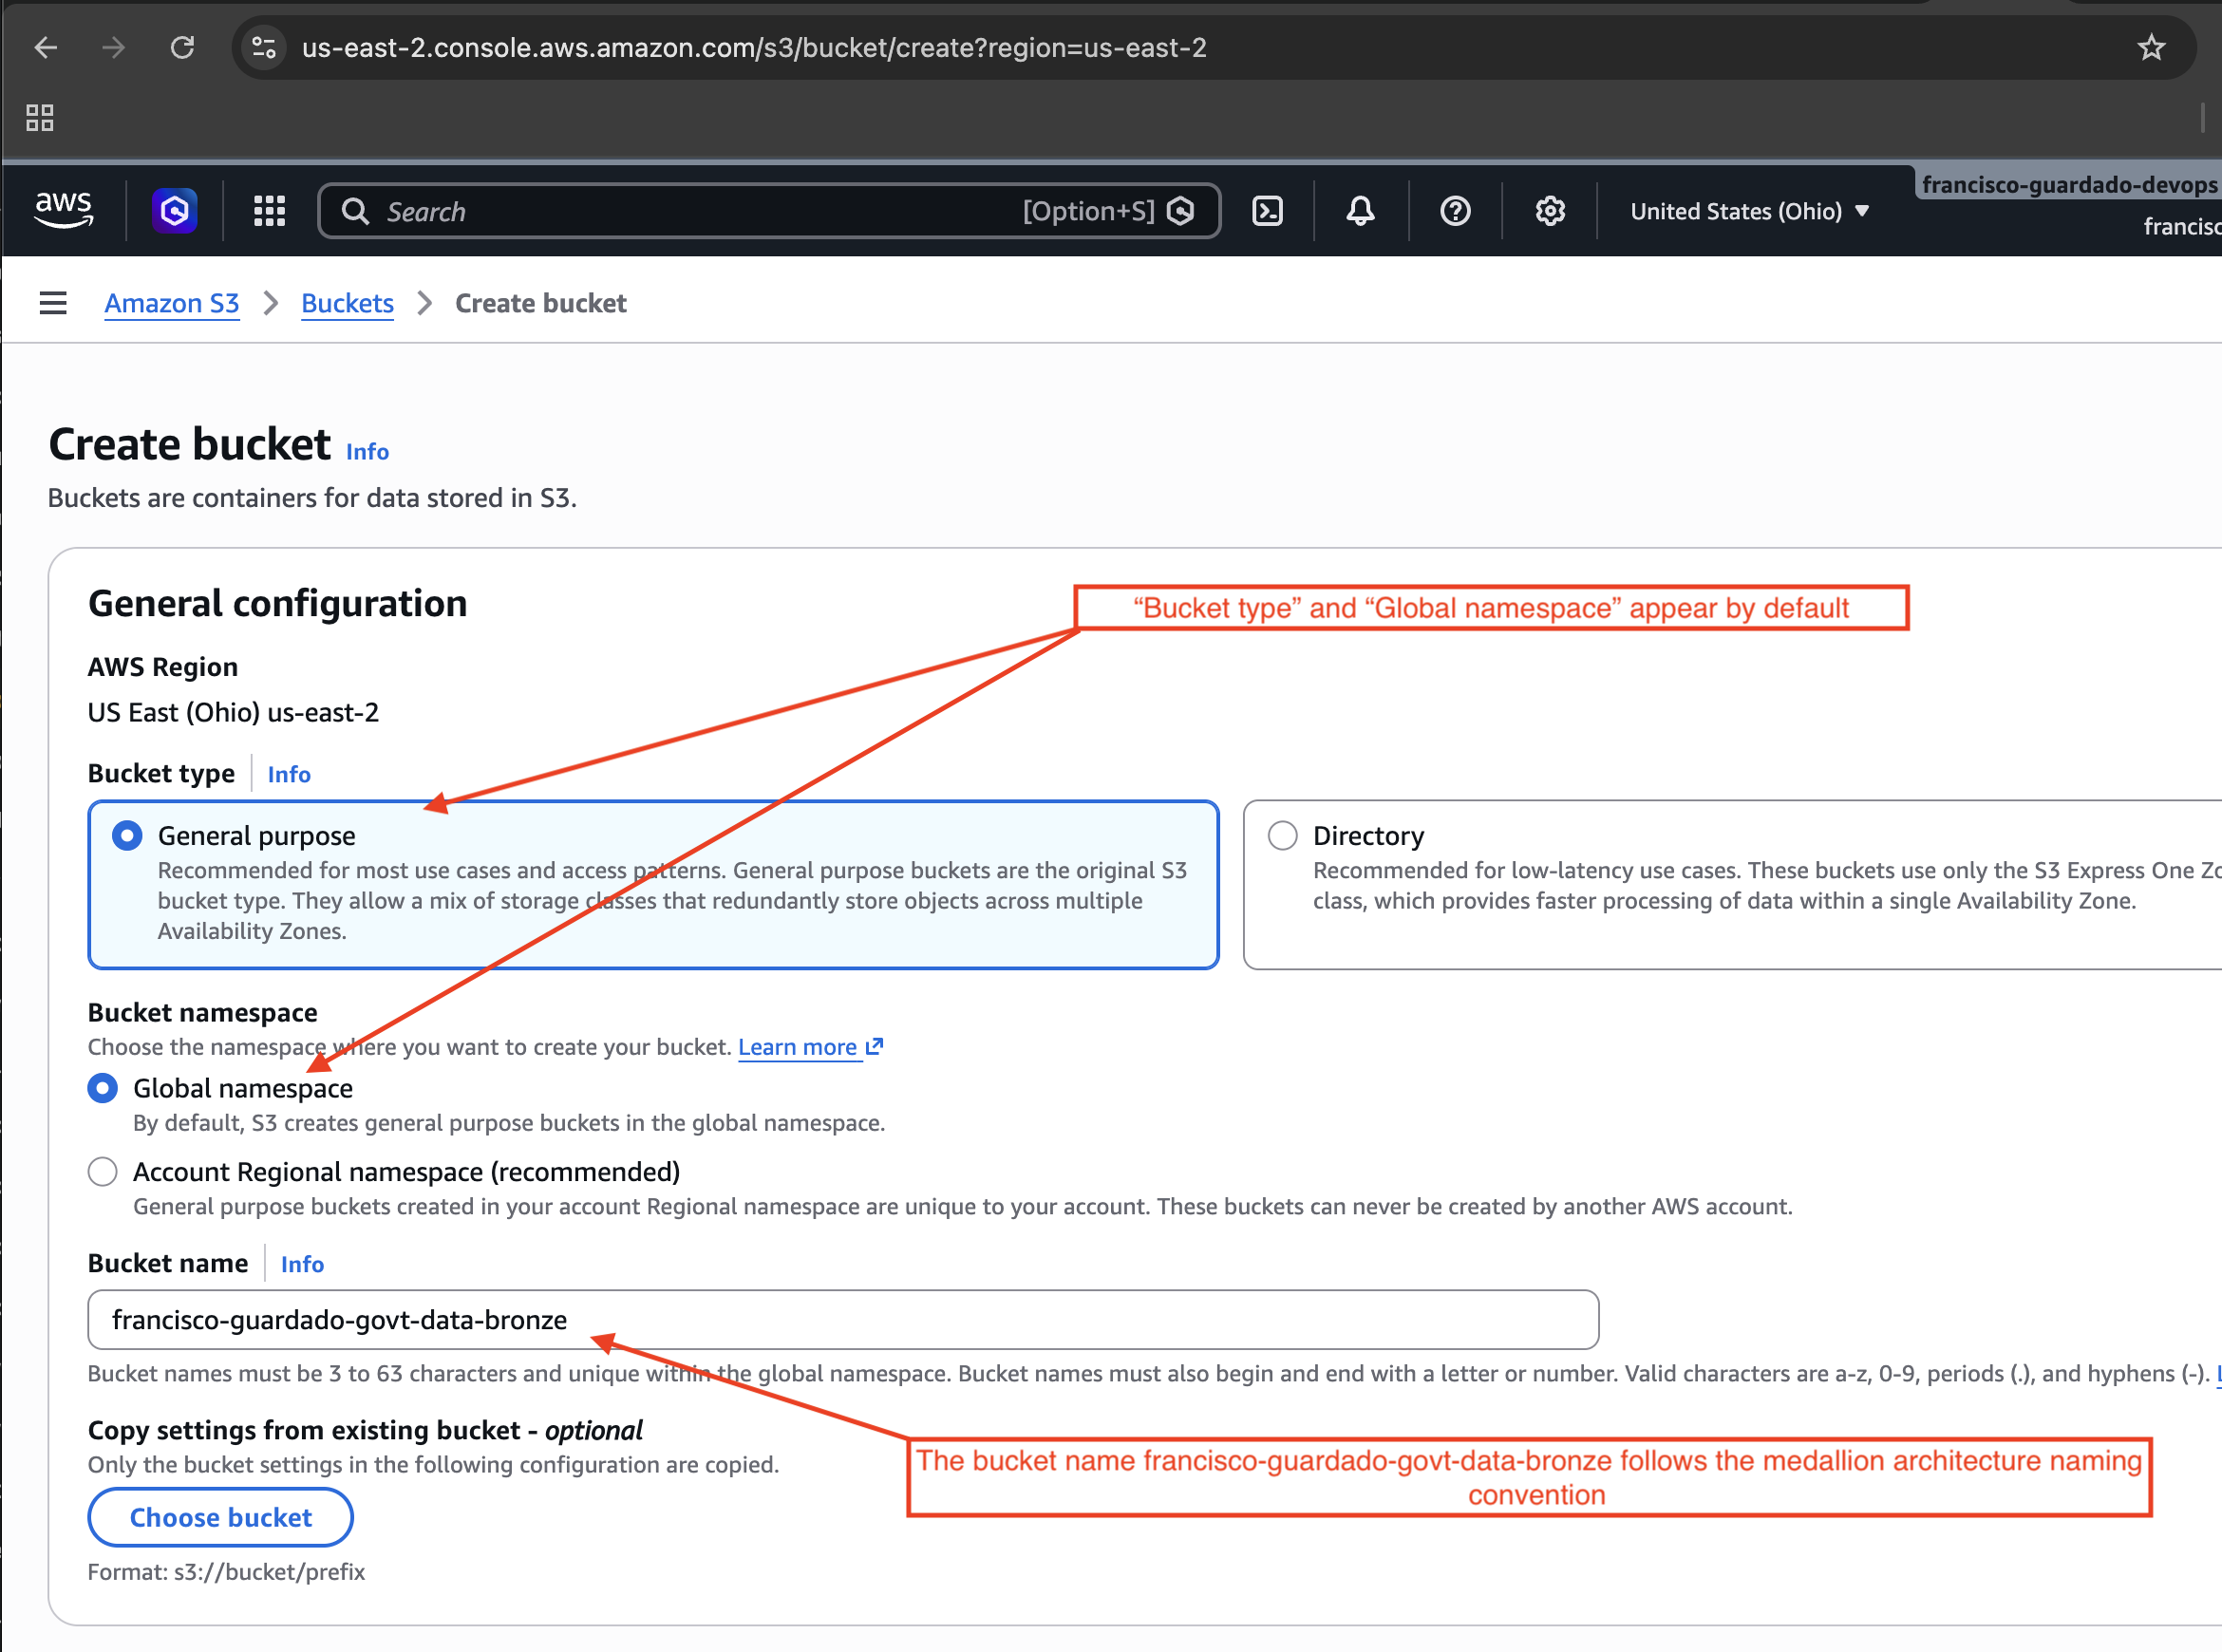
Bronze refers to the first layer of the pipeline where raw, unprocessed government data lands before any transformation.
When Databricks connects to this S3 bucket, the name immediately communicates the data's position in the pipeline which is a raw ingestion layer.
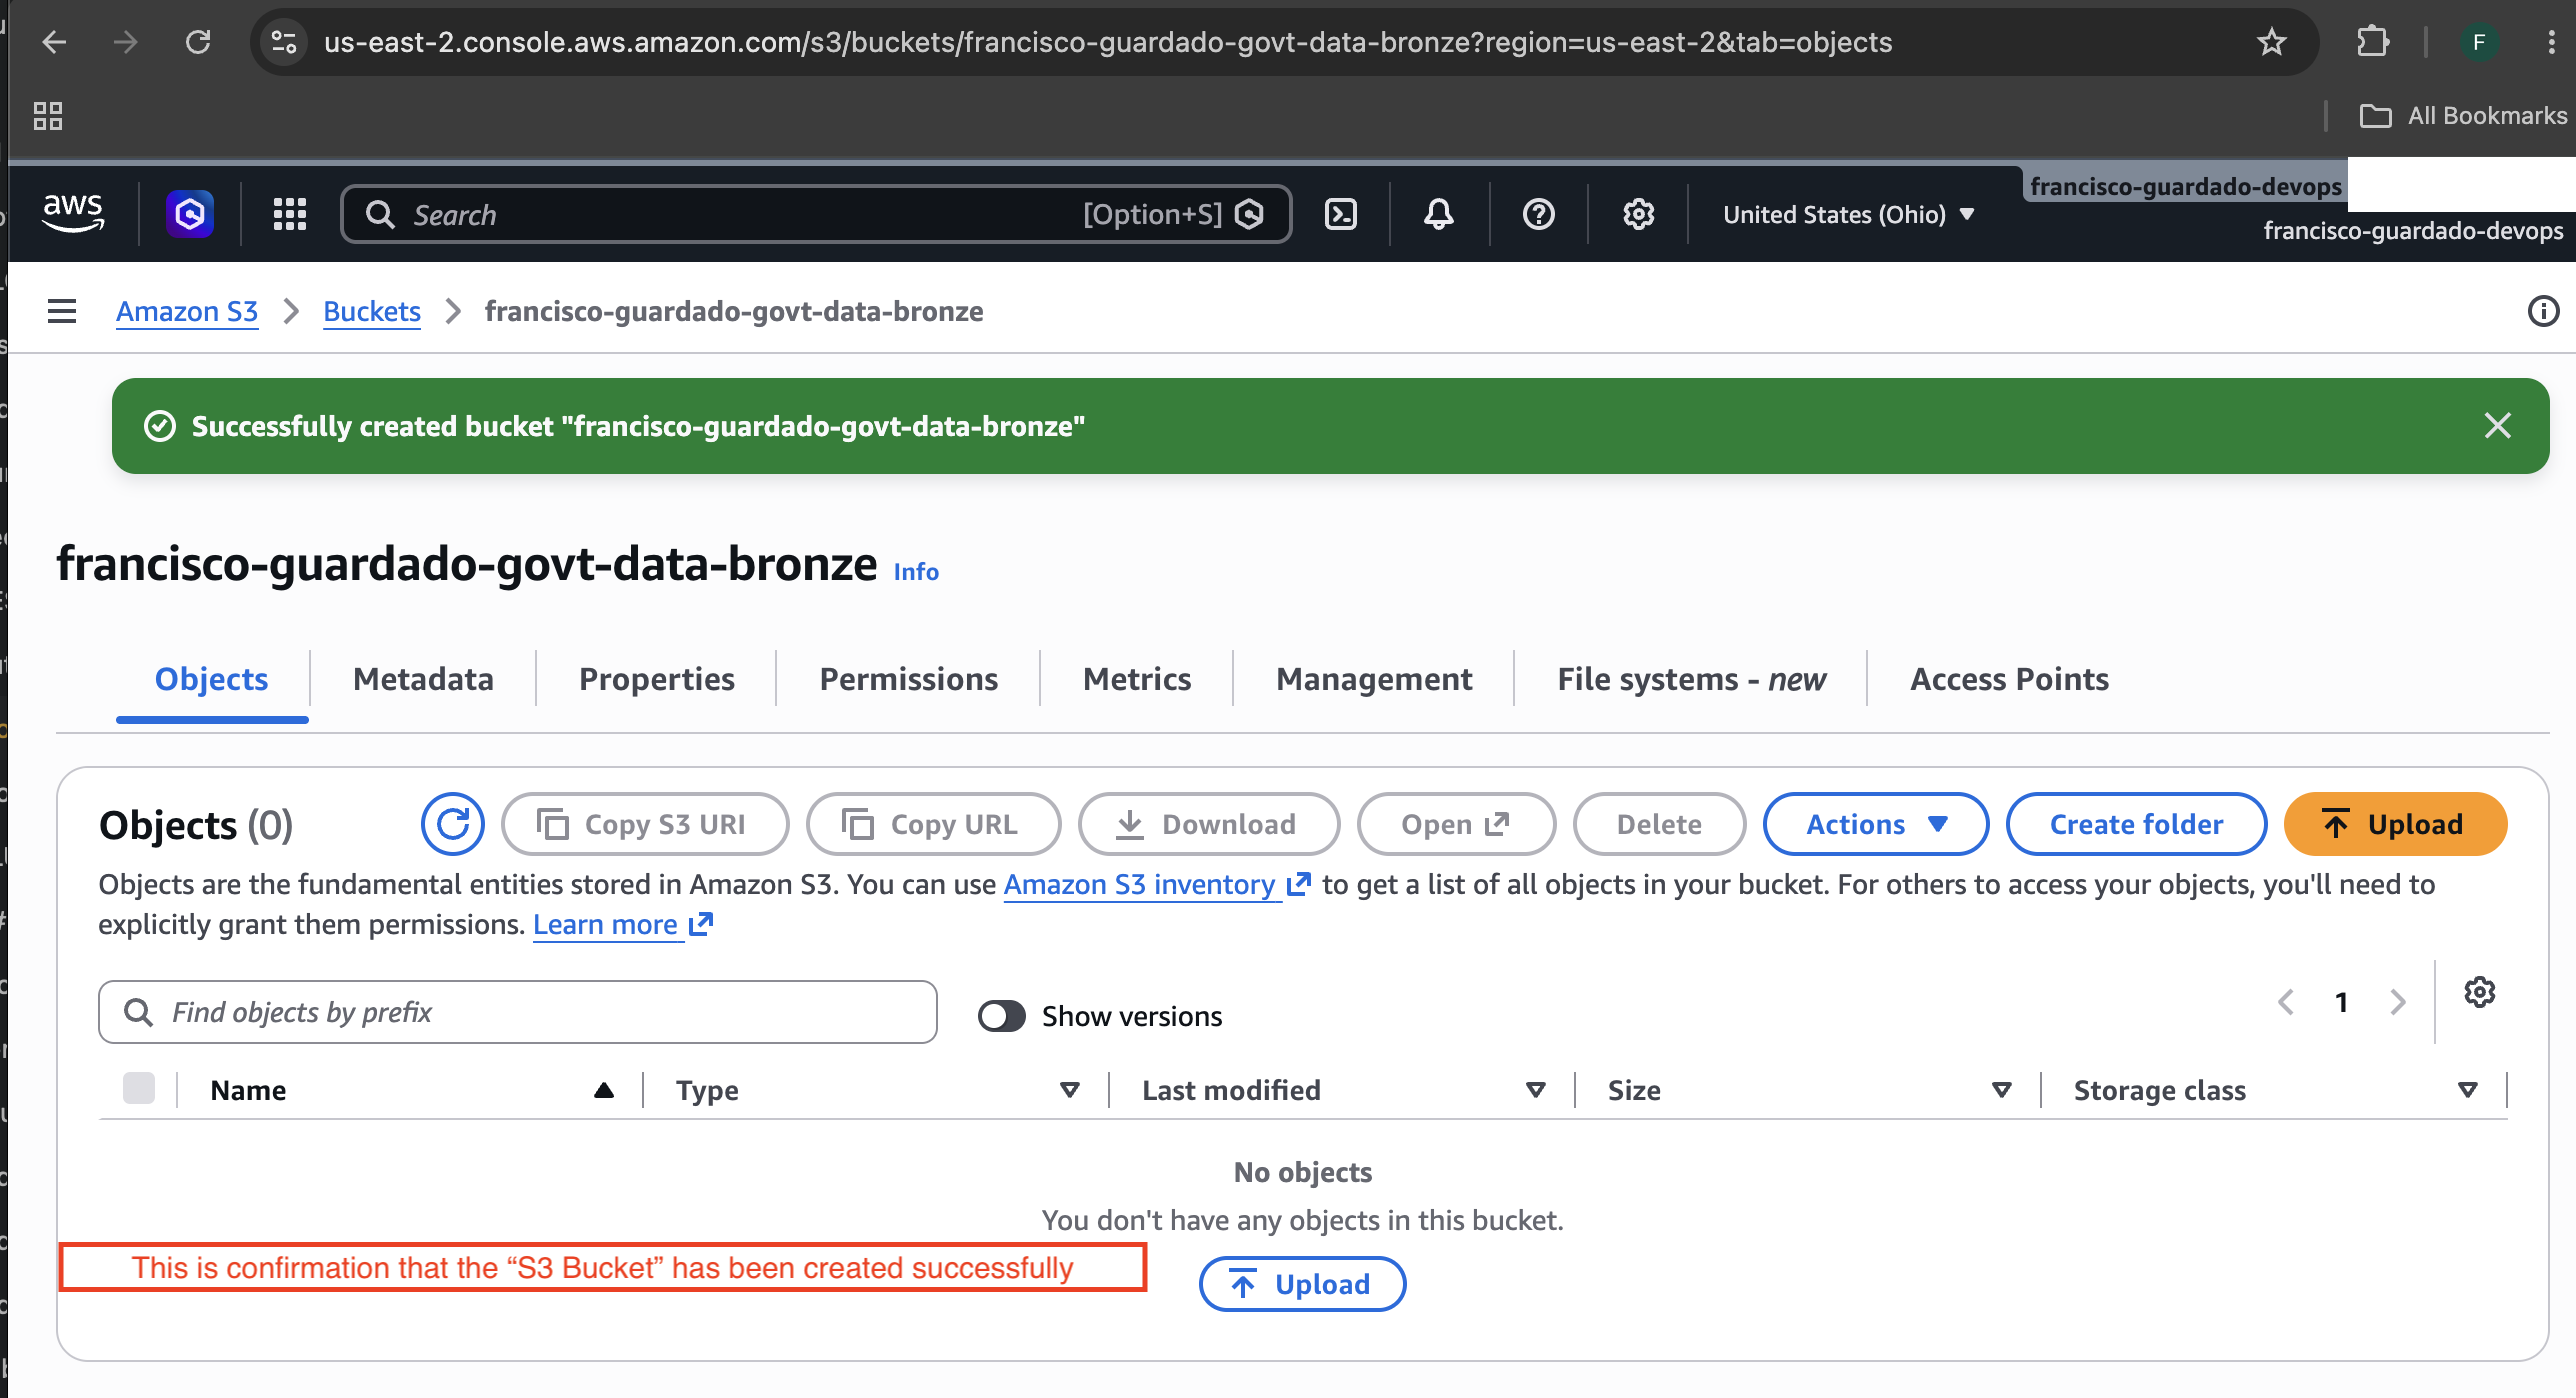
by now, my first S3 Bucket has been created. The next screenshot shows an uploaded CSV file. I got this file from https://catalog.data.gov/ open source.
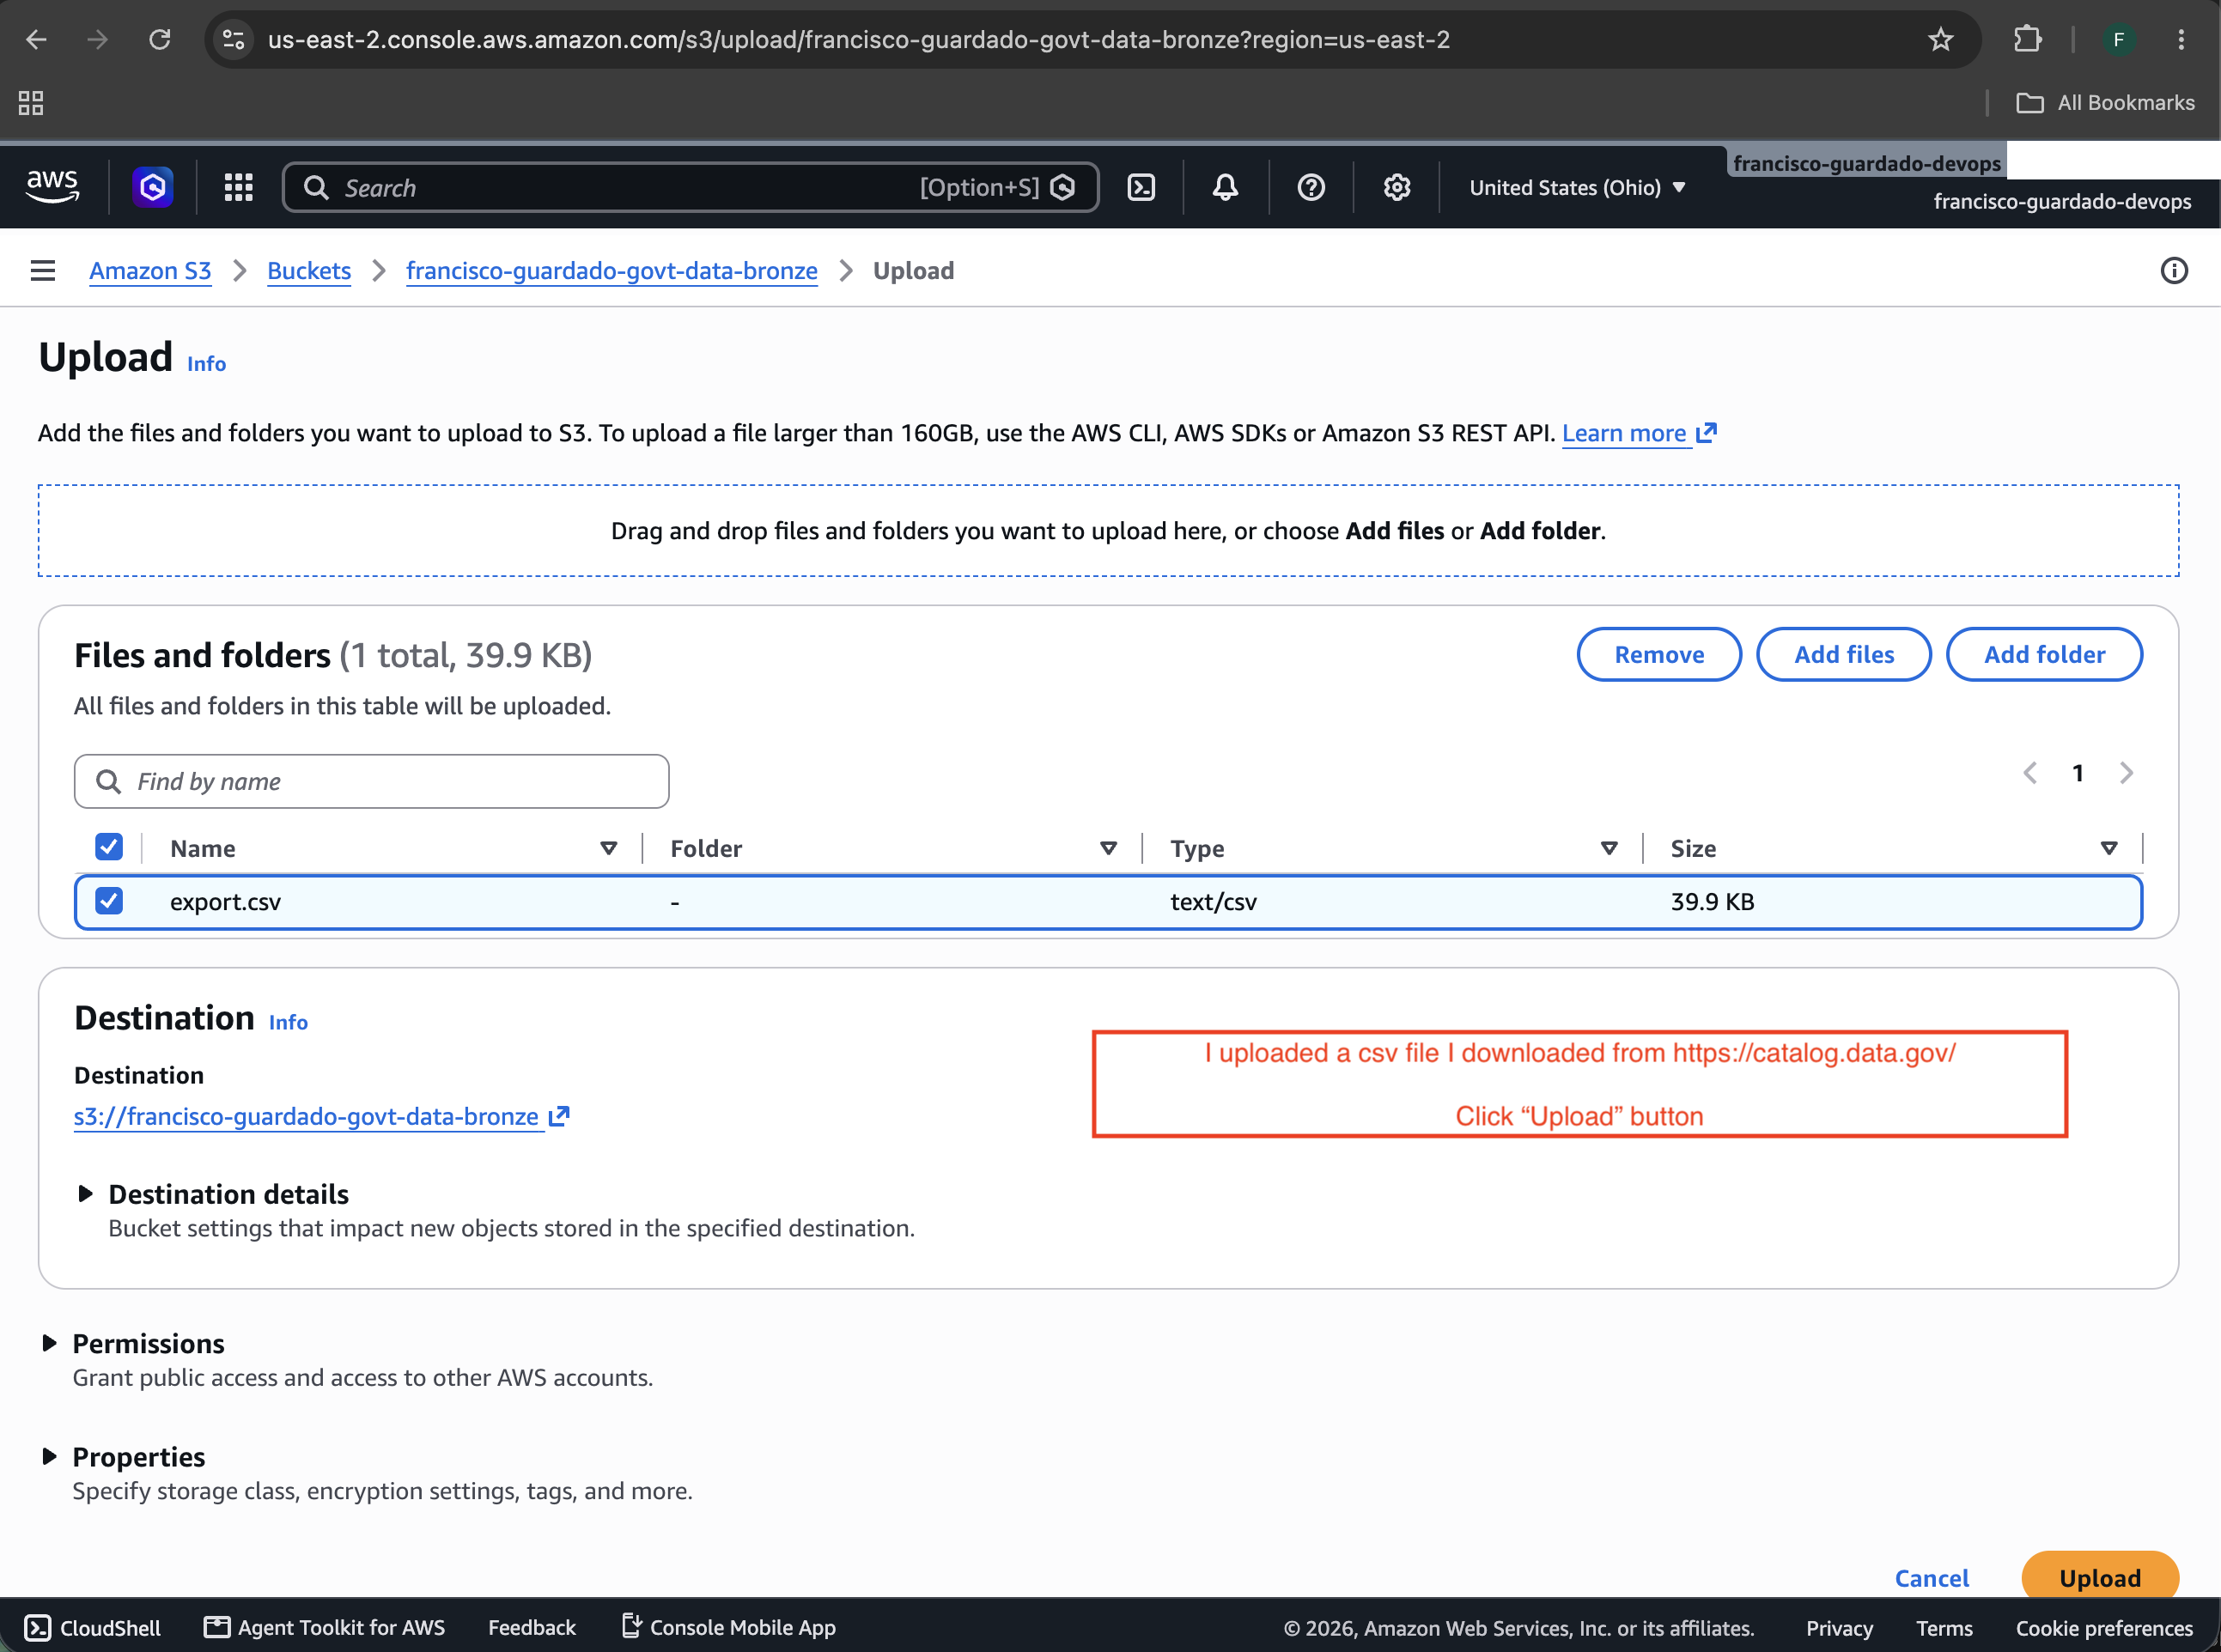
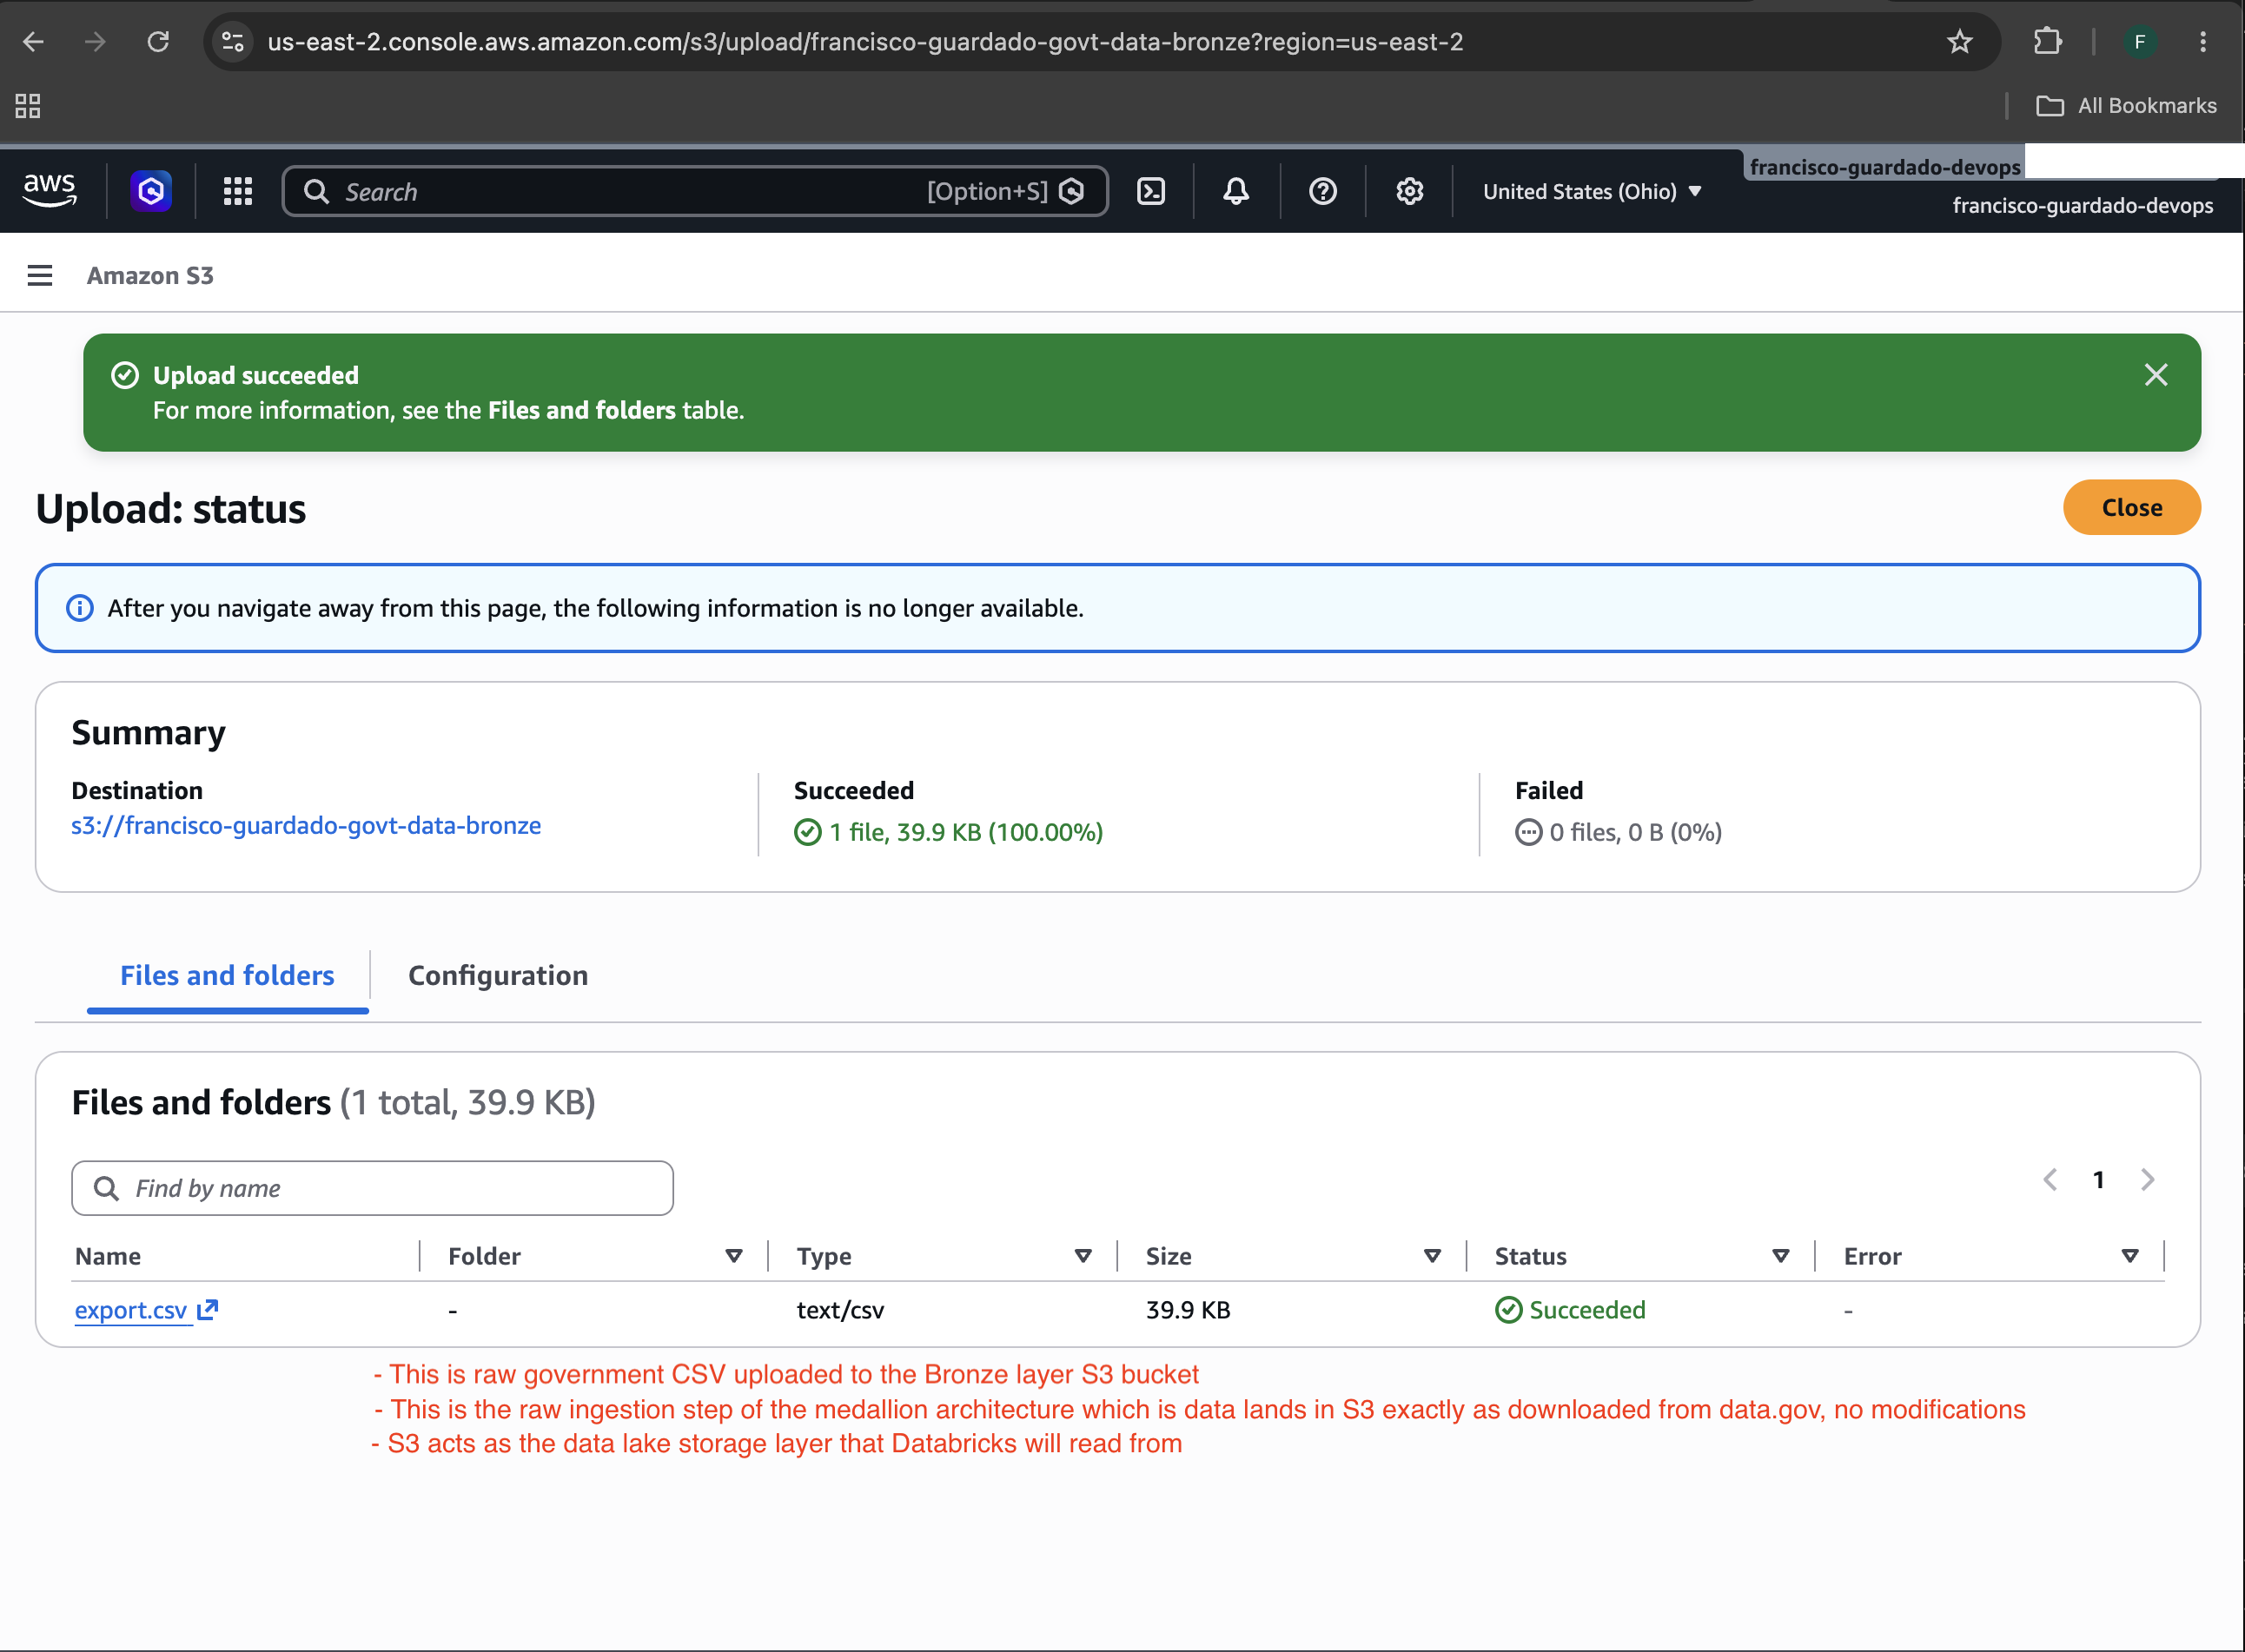
- Raw government CSV uploaded to the Bronze layer S3 bucket
- This is the raw ingestion step of the medallion architecture which is data lands in S3 exactly as downloaded from data.gov, no modifications
- S3 acts as the data lake storage layer that Databricks will read from
"IAM"
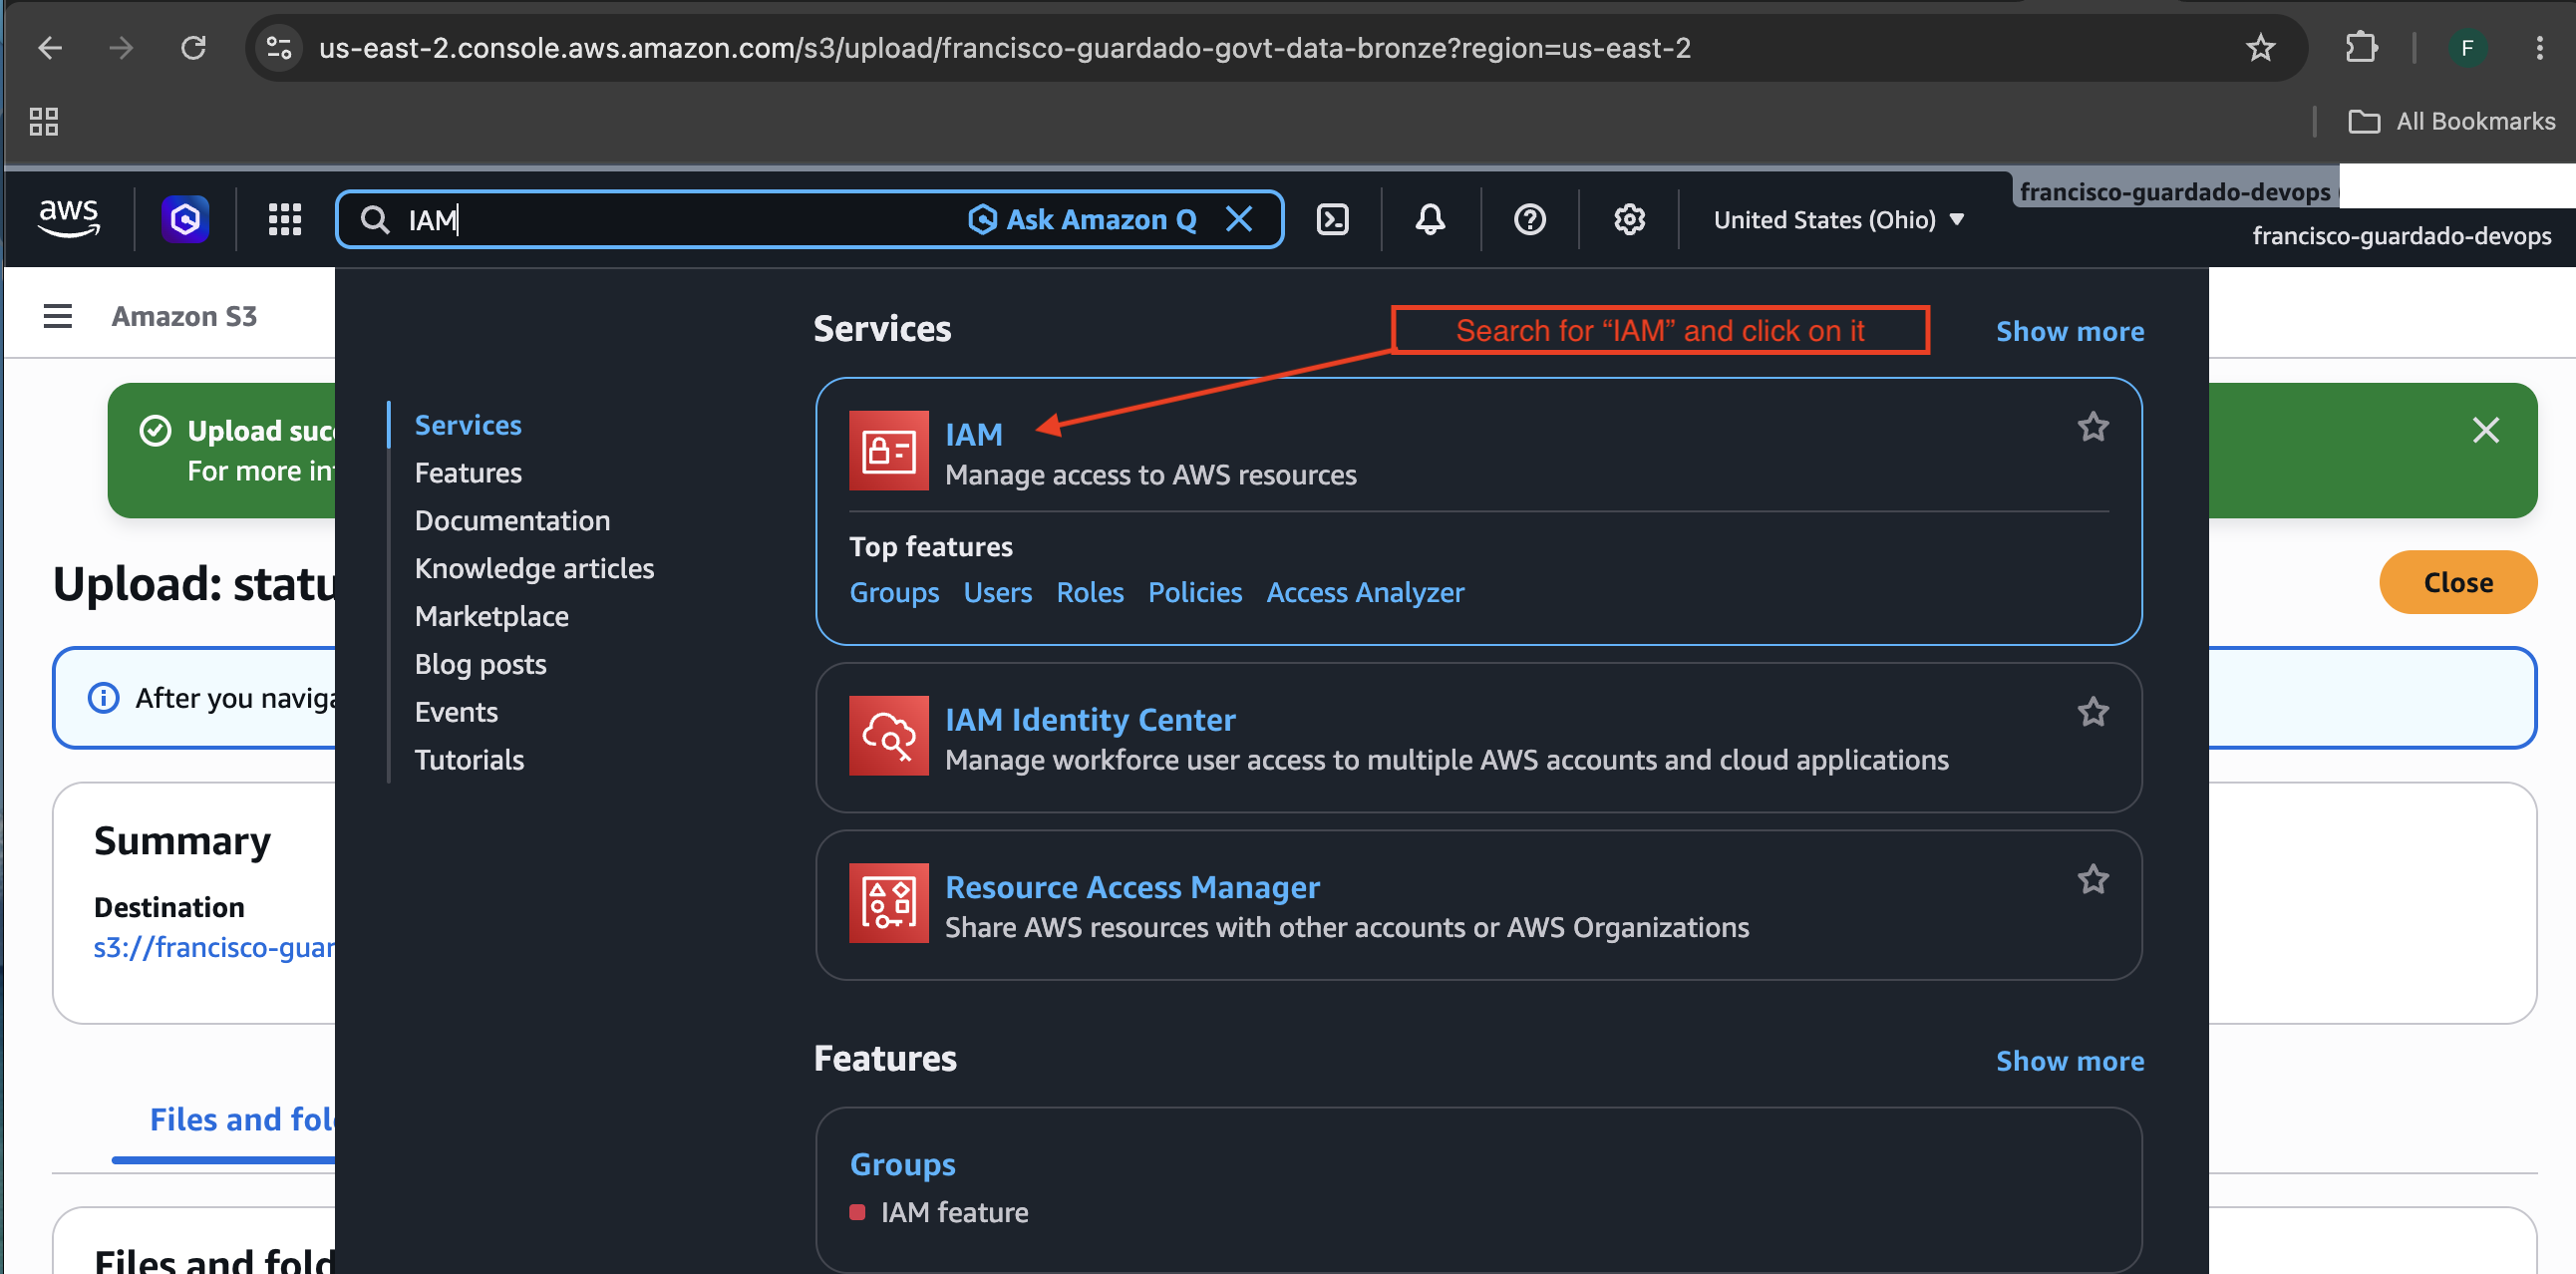
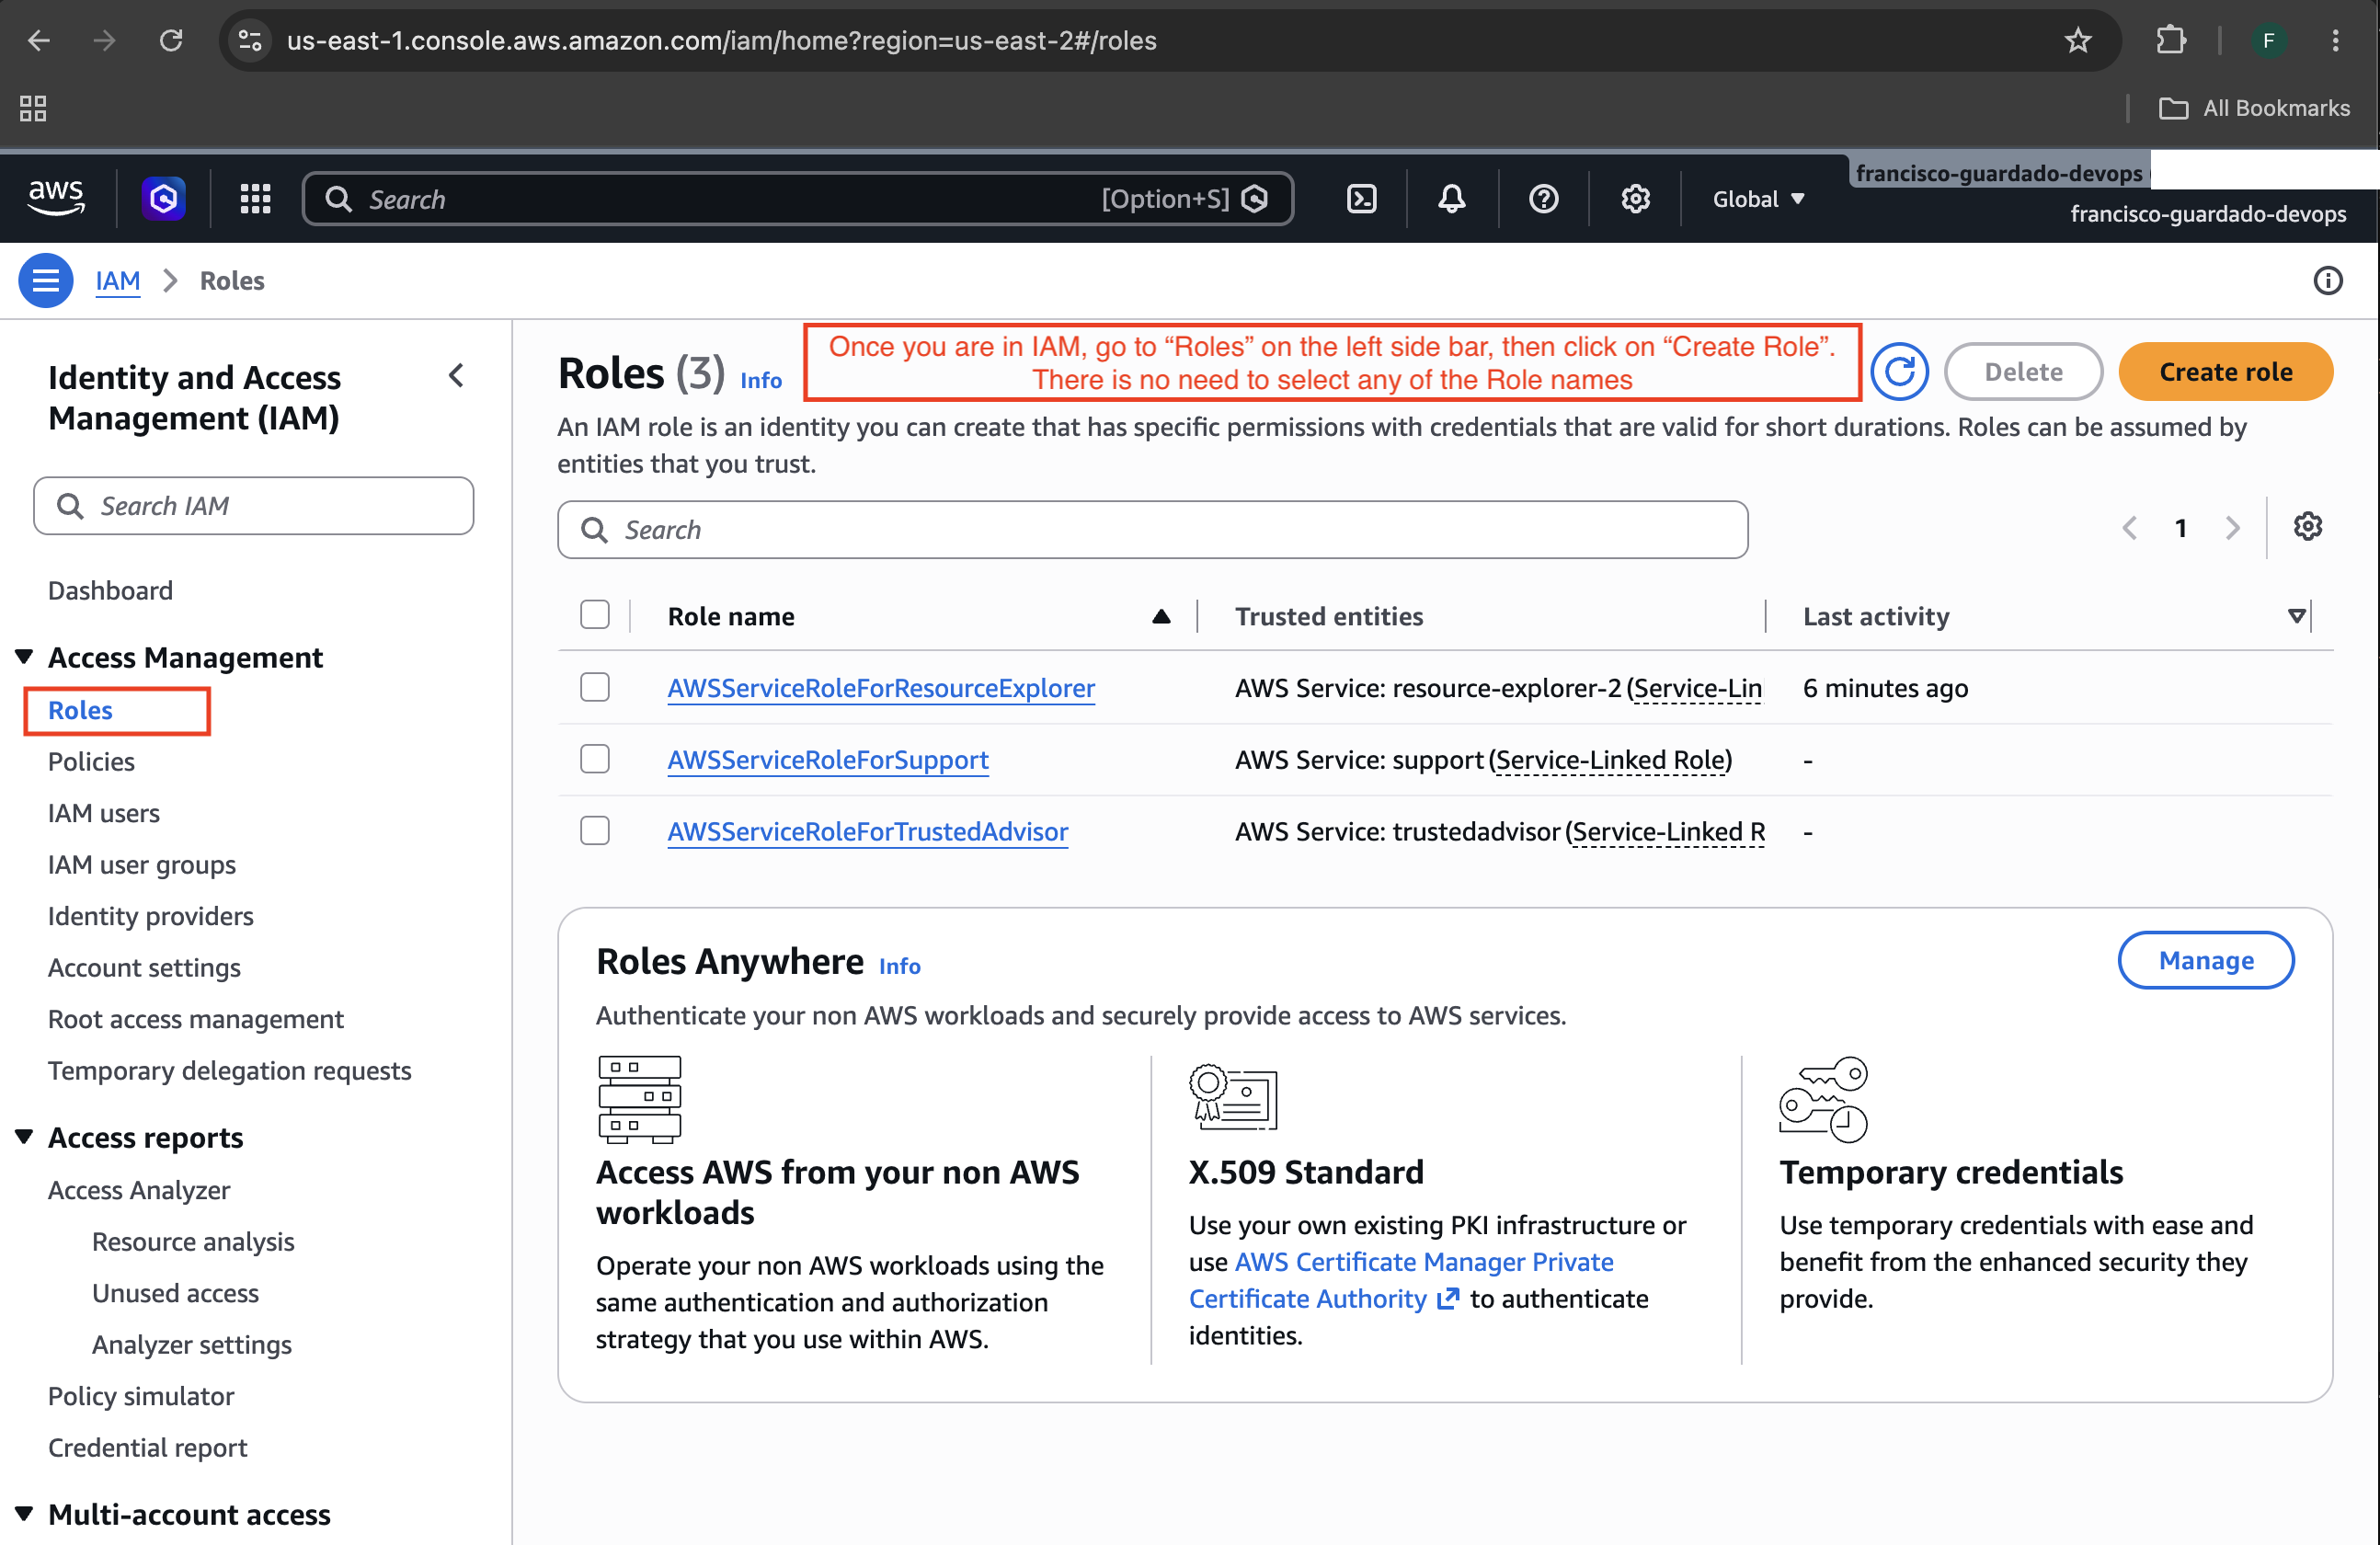
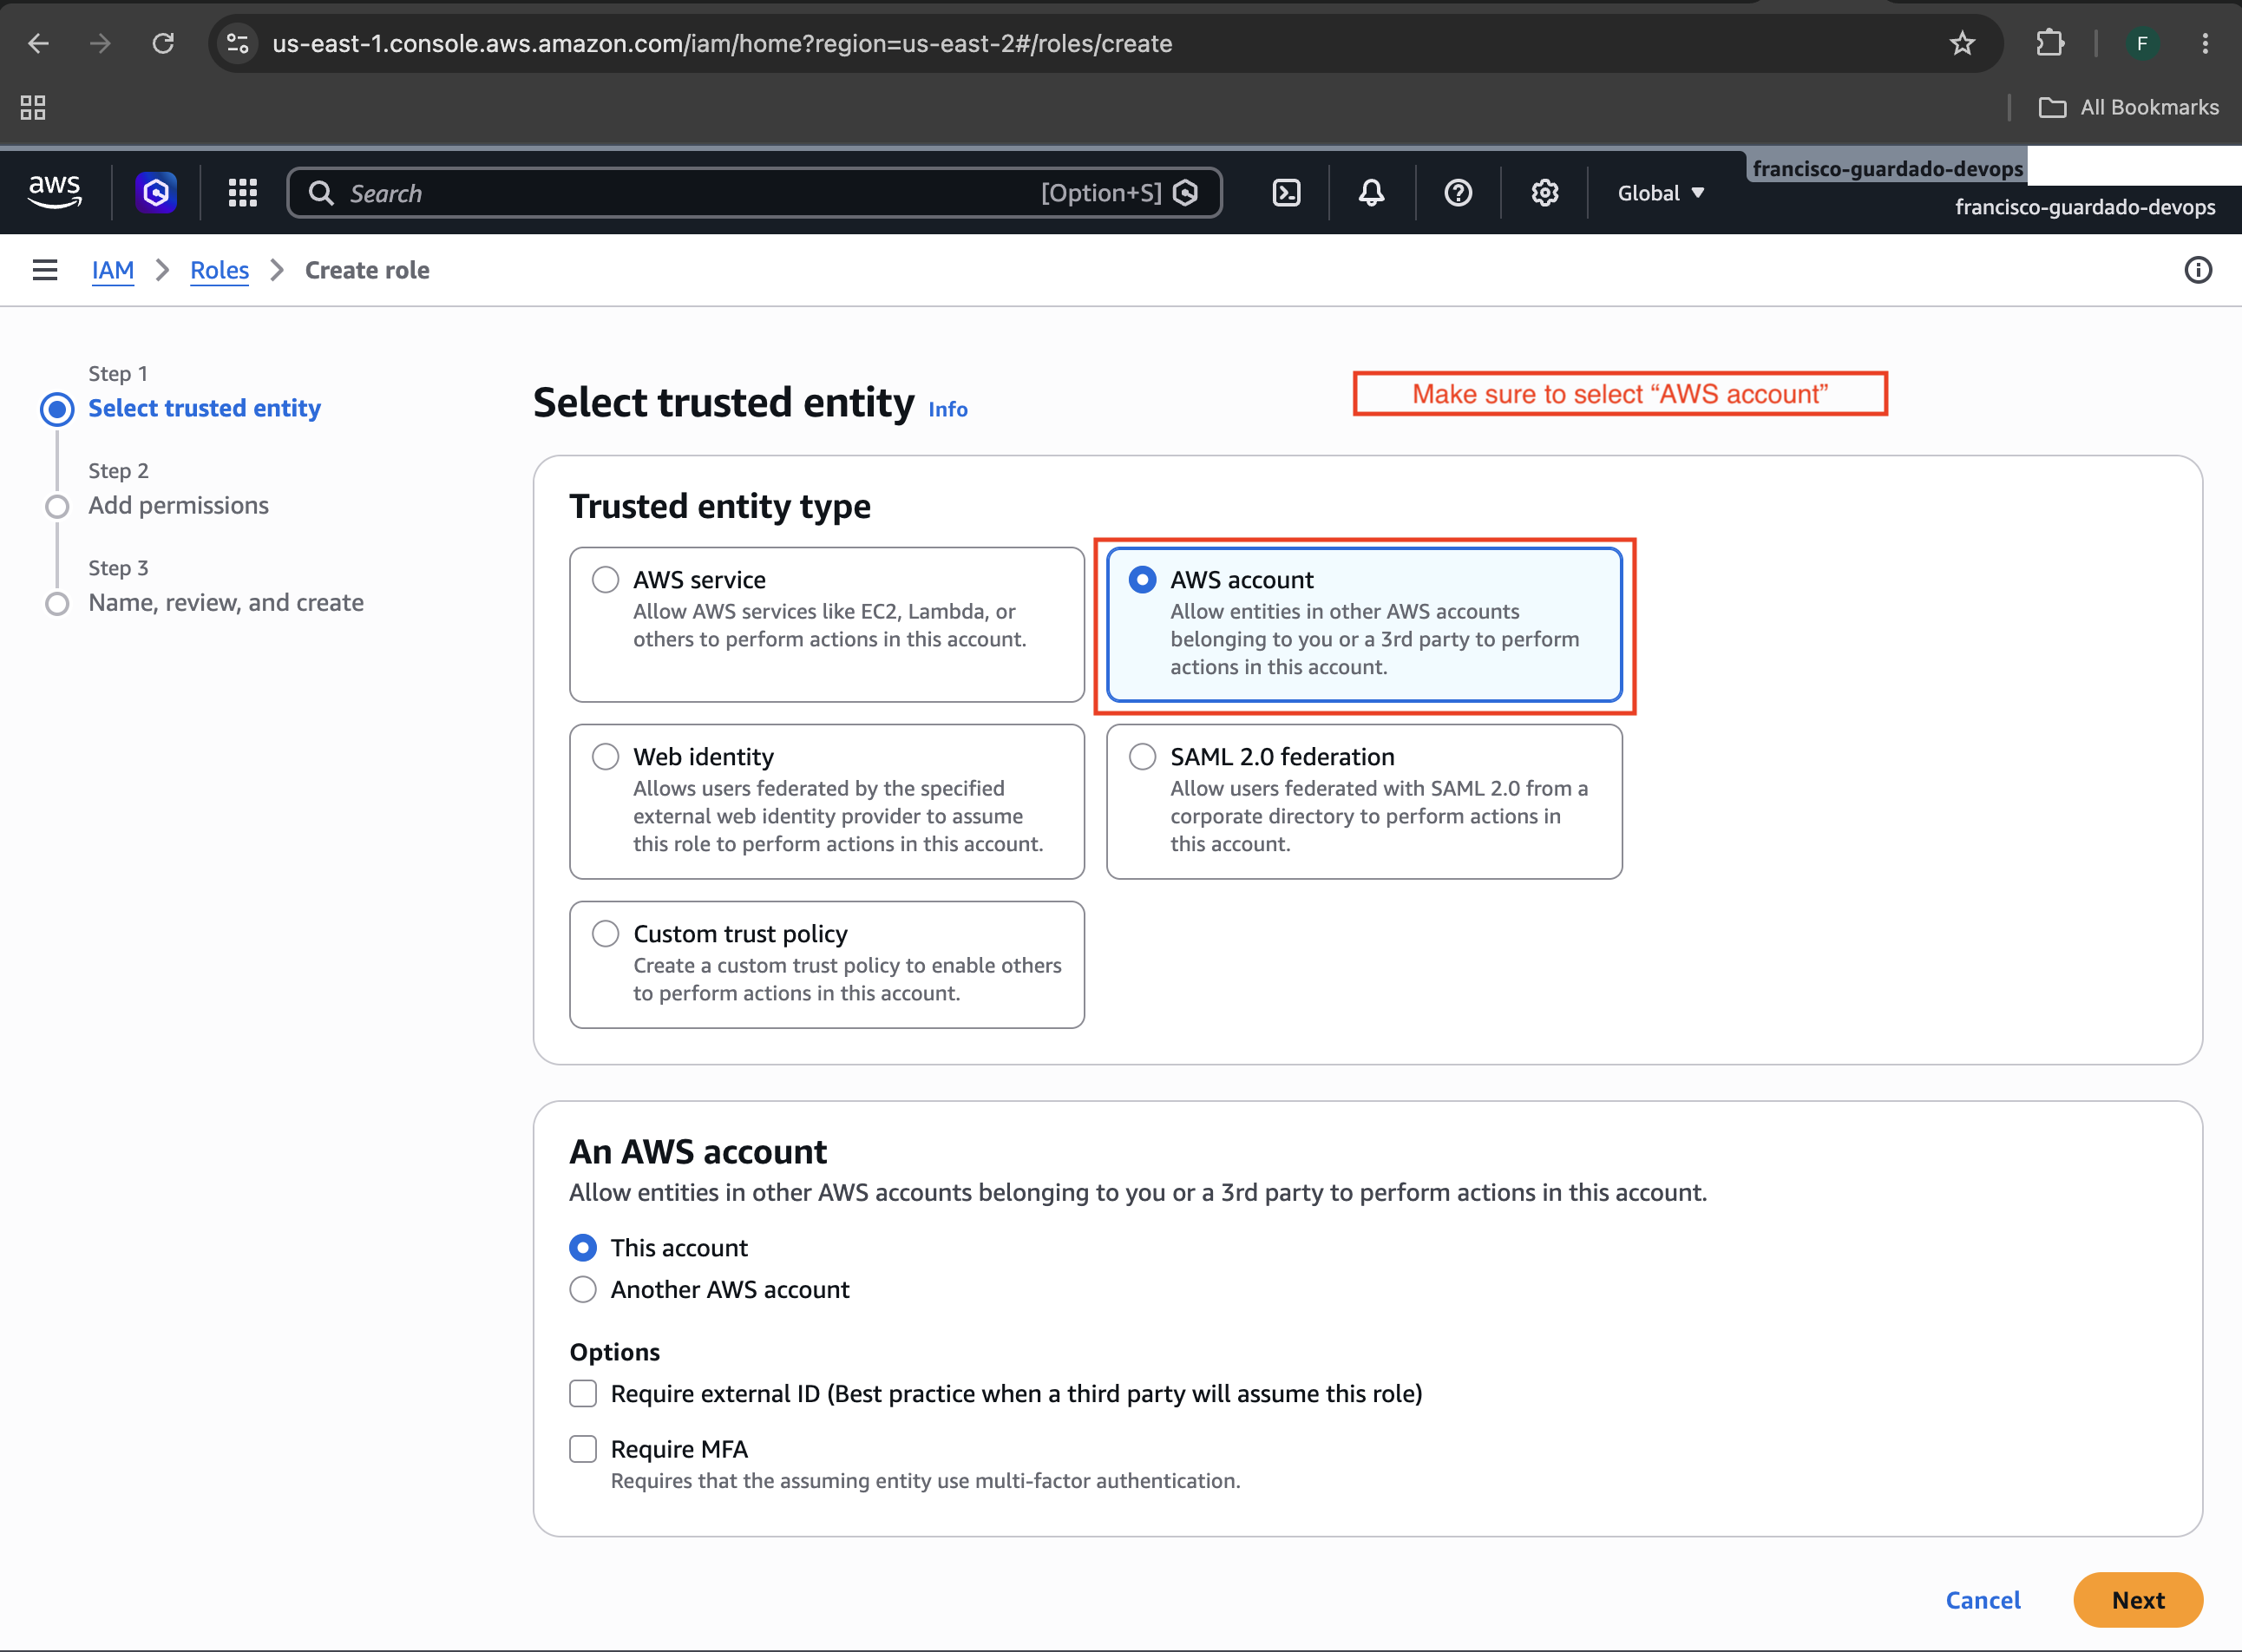
Once you are in IAM, make sure to go to Roles and click on "Create role". There is no need to select any of the role names.
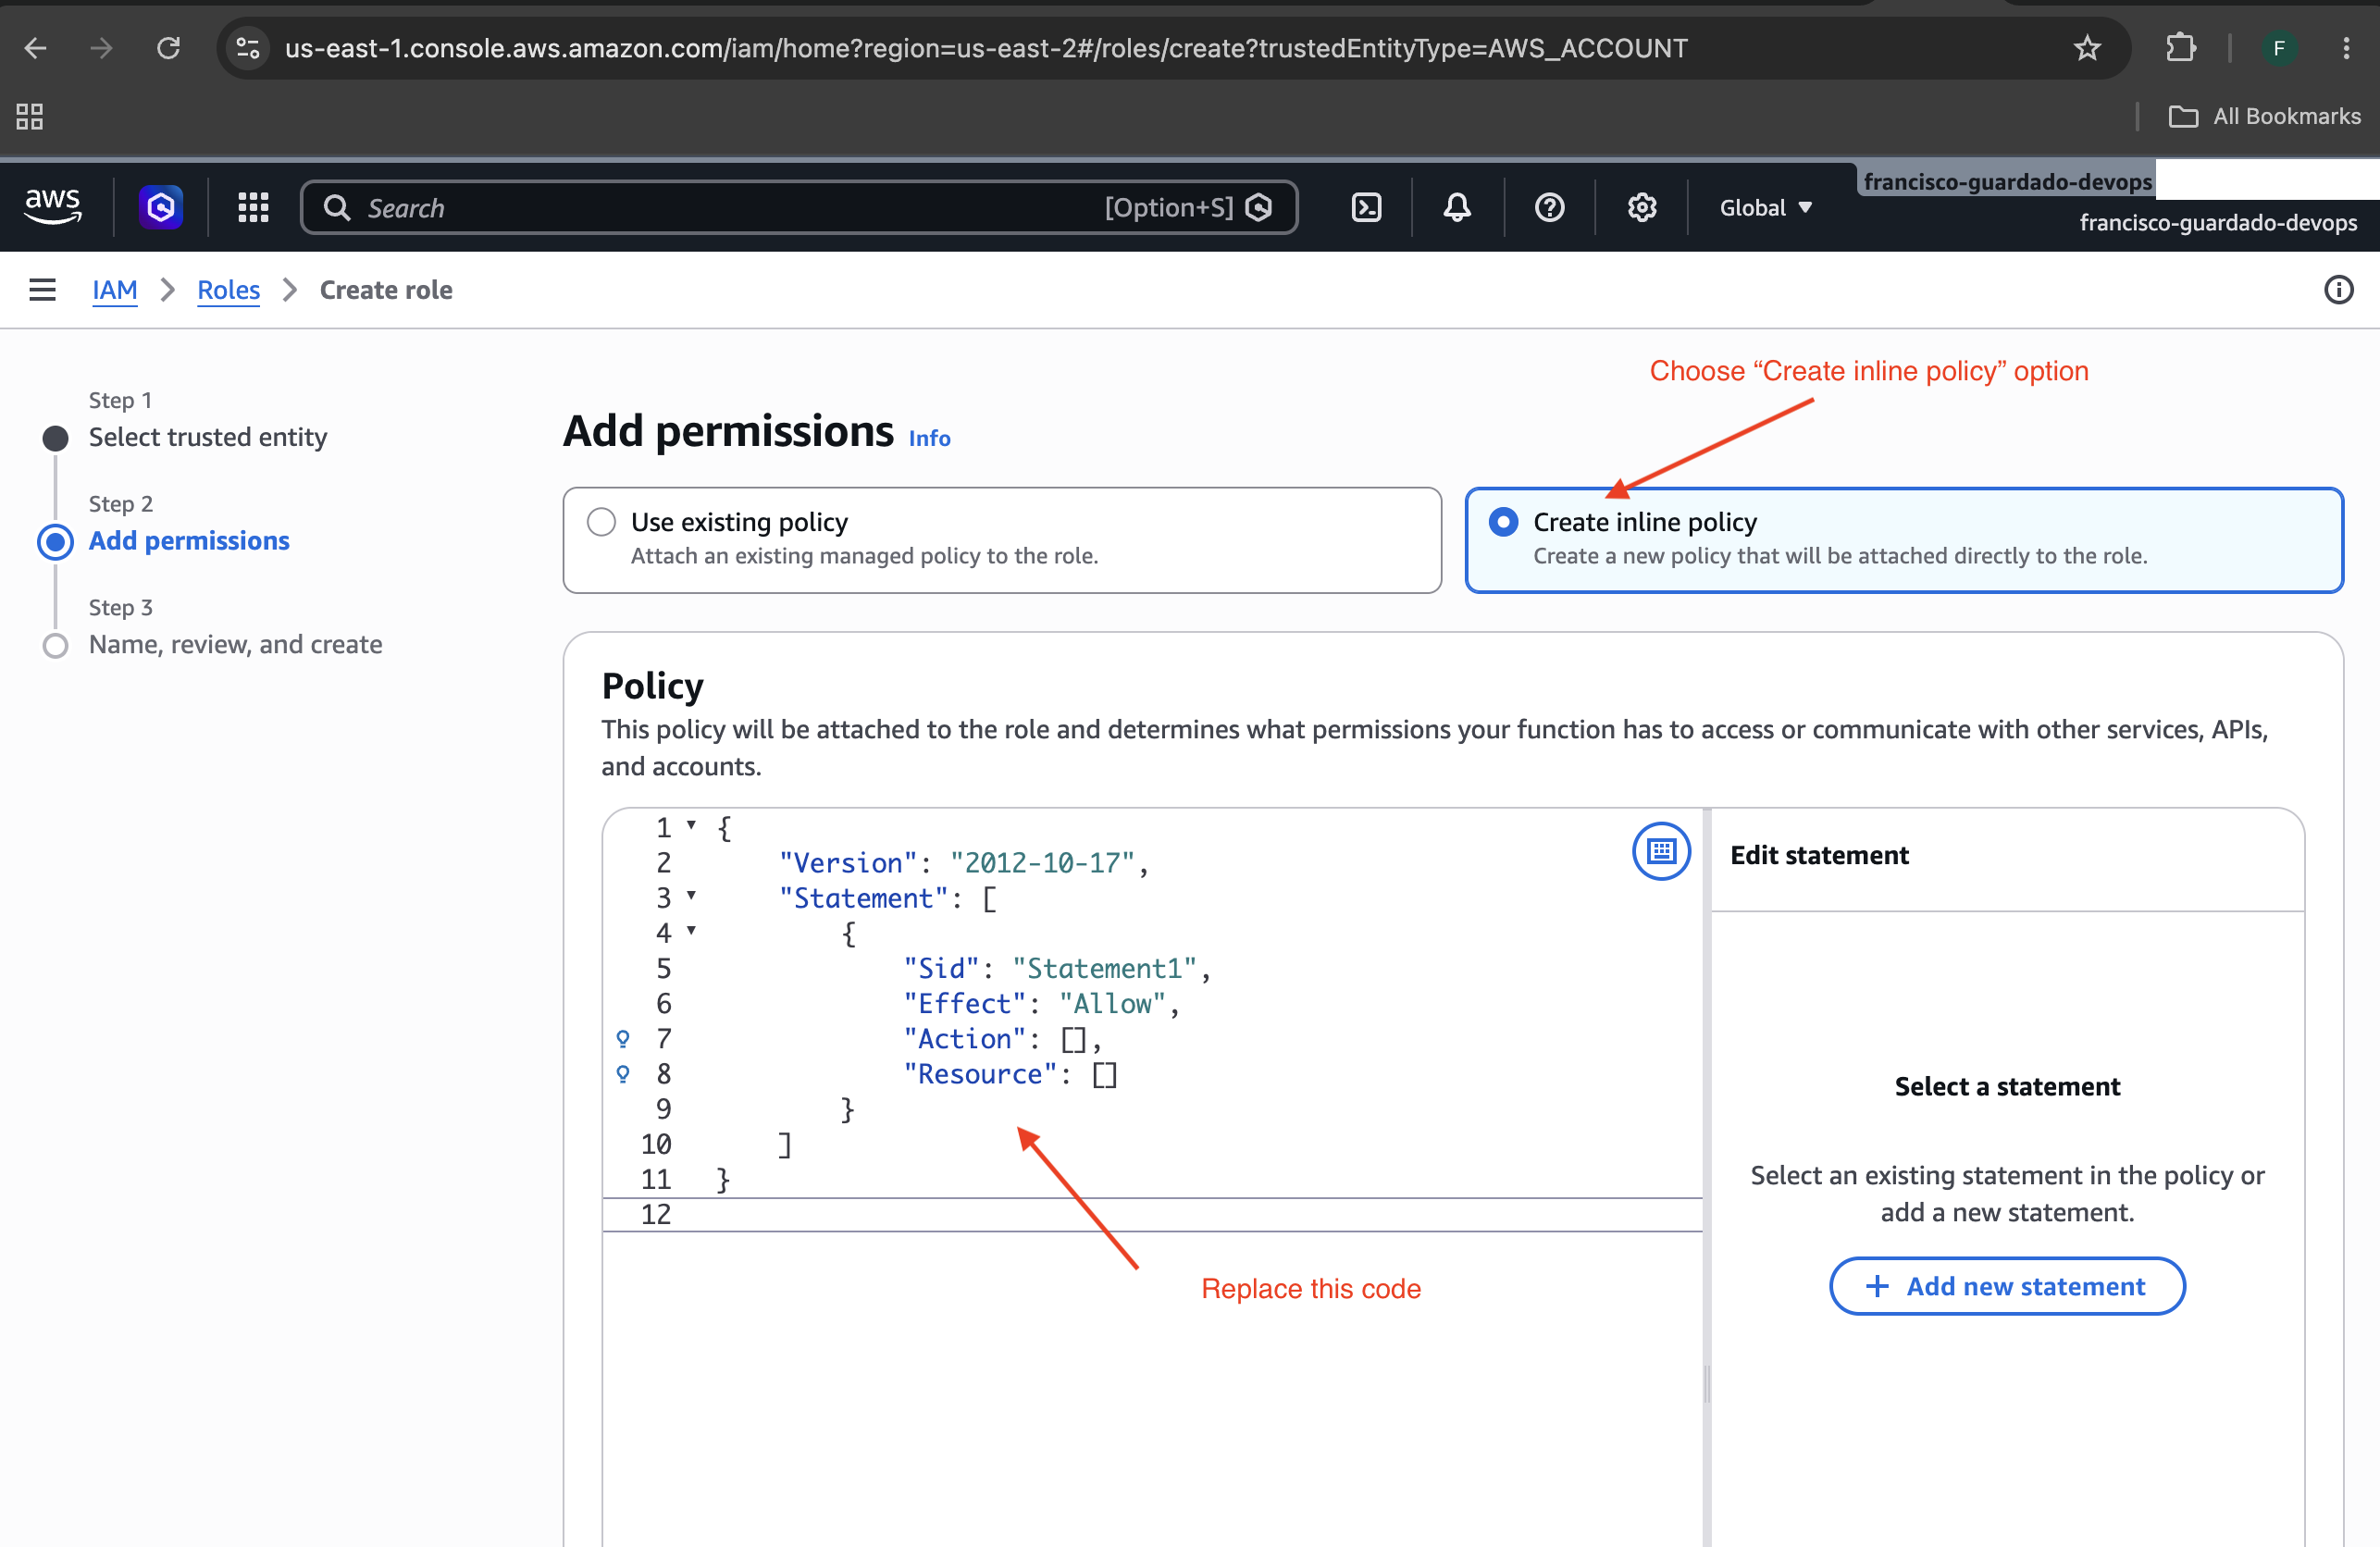
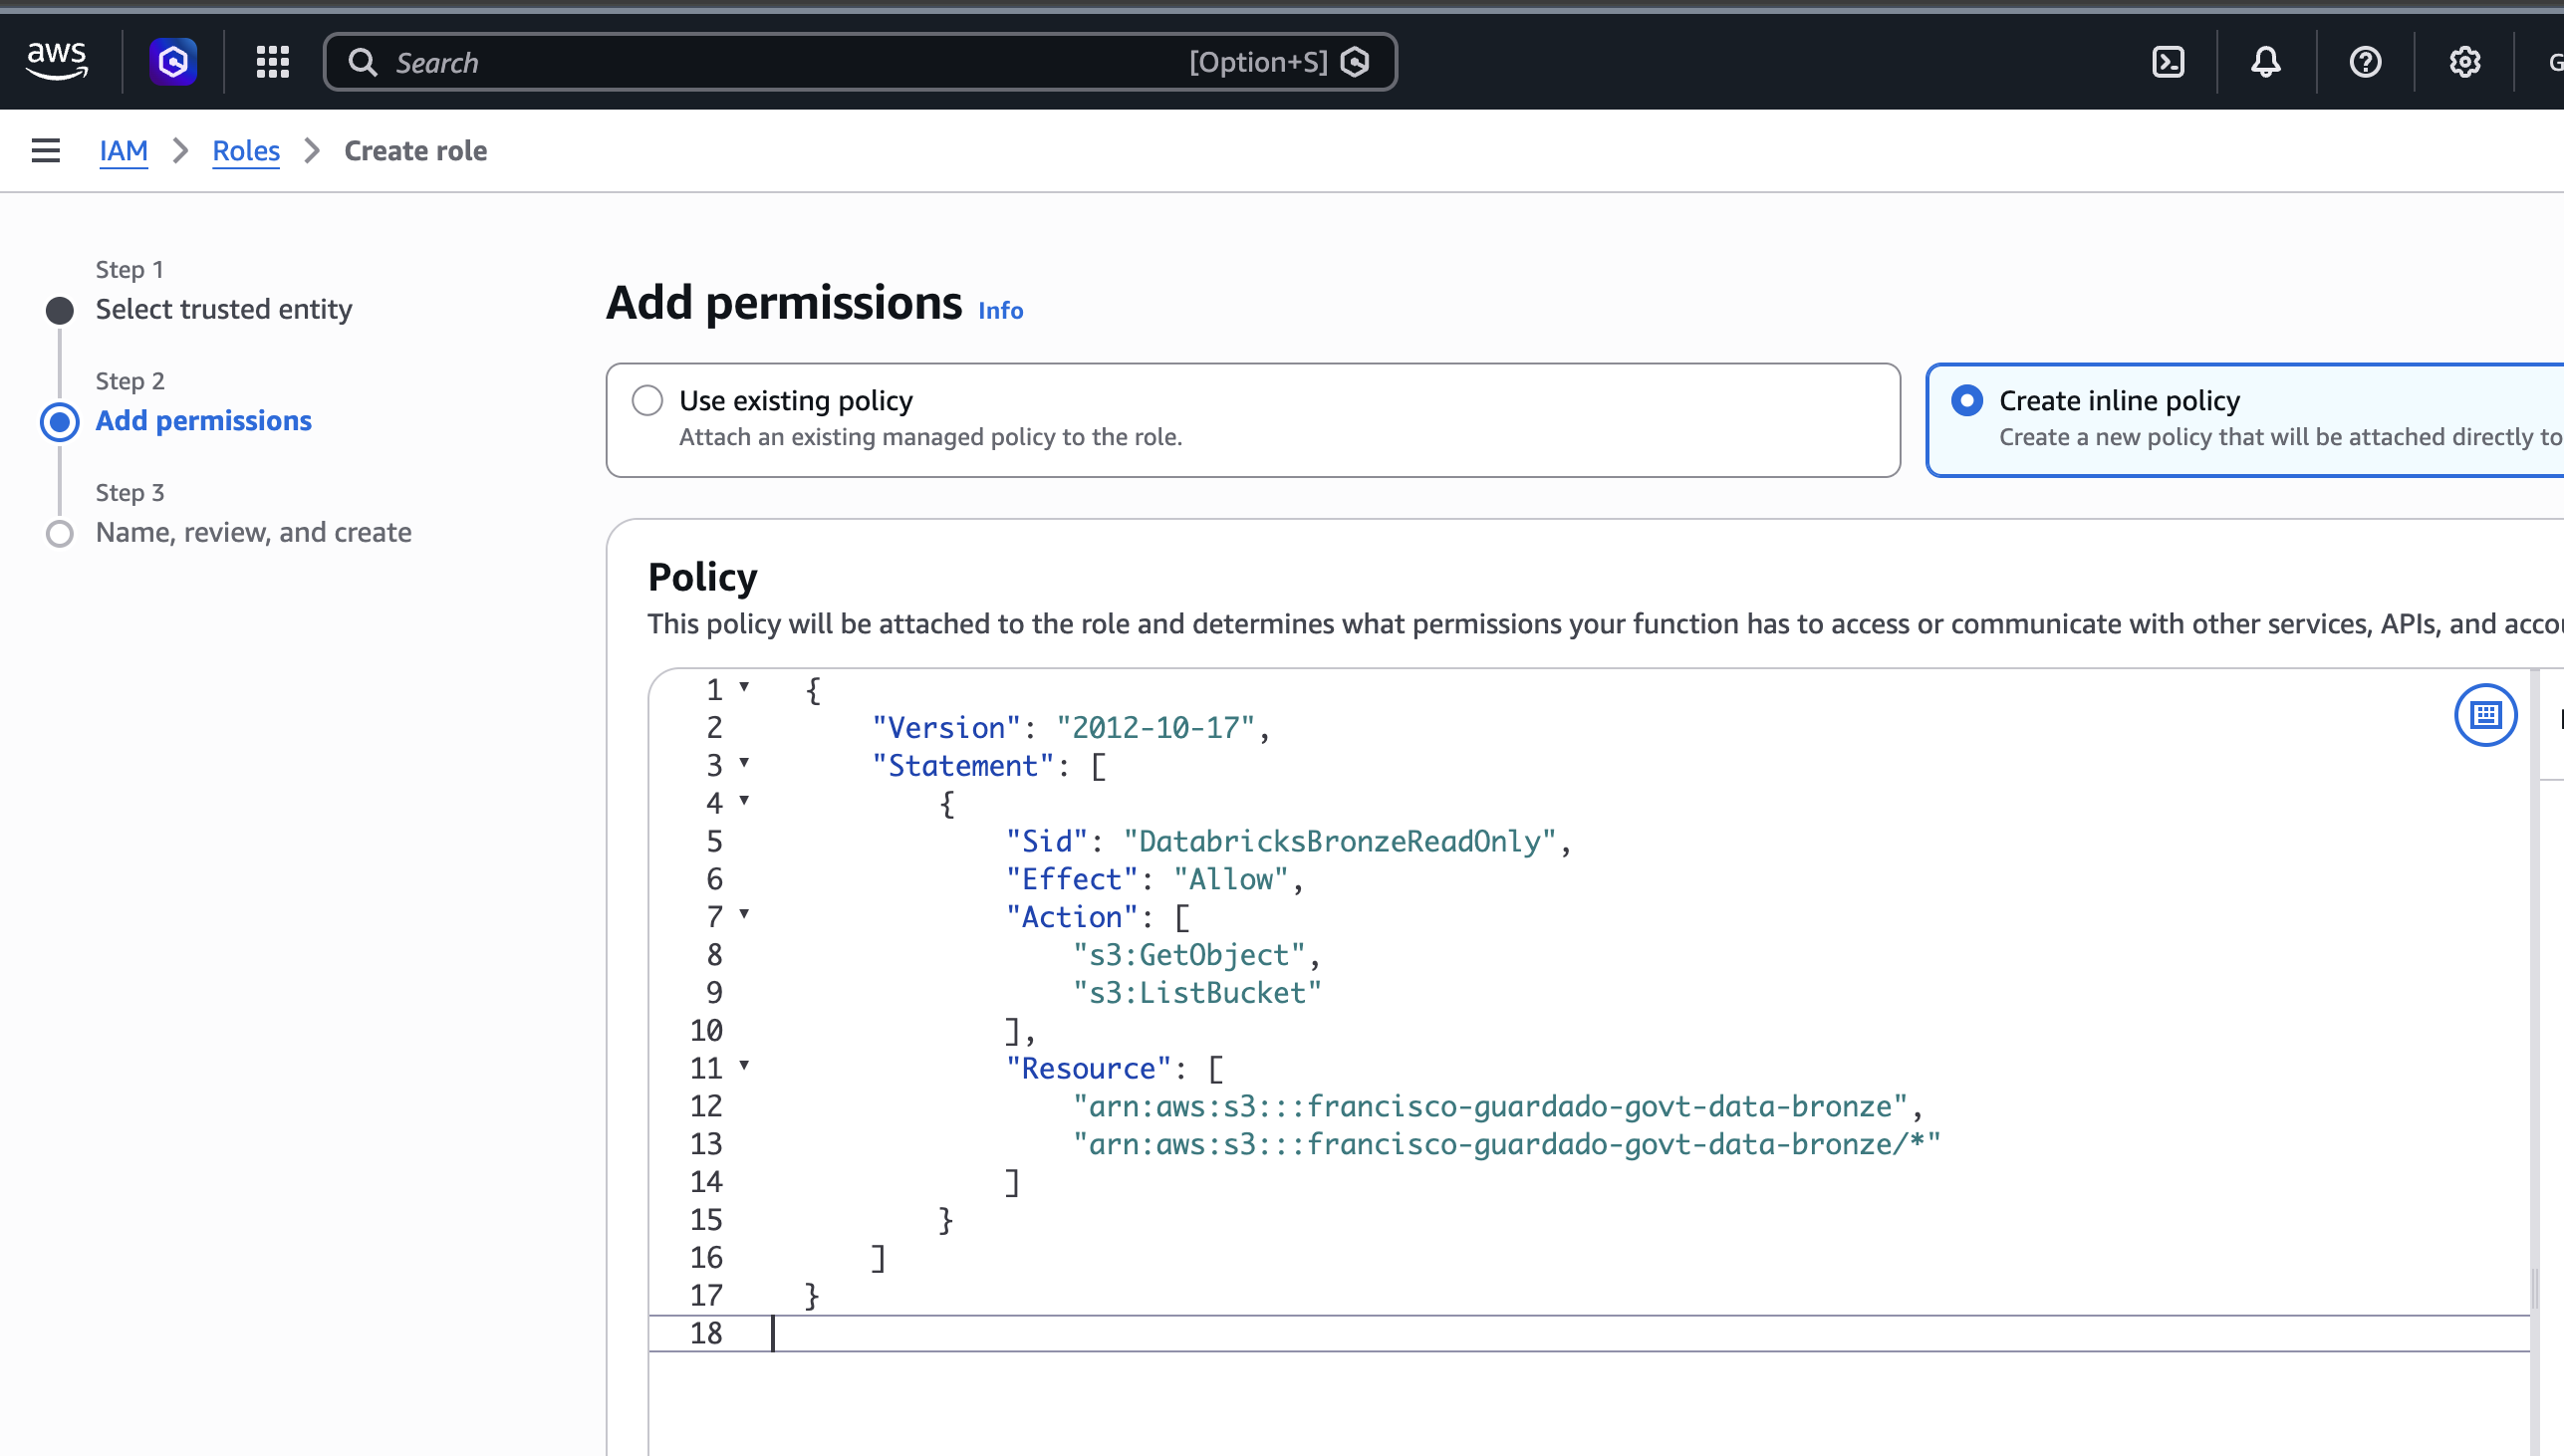
Replace everything in that editor with this exact policy:
{
"Version": "2012-10-17",
"Statement": [
{
"Sid": "DatabricksBronzeReadOnly",
"Effect": "Allow",
"Action": [
"s3:GetObject",
"s3:ListBucket"
],
"Resource": [
"arn:aws:s3:::francisco-guardado-govt-data-bronze",
"arn:aws:s3:::francisco-guardado-govt-data-bronze/*"
]
}
]
}
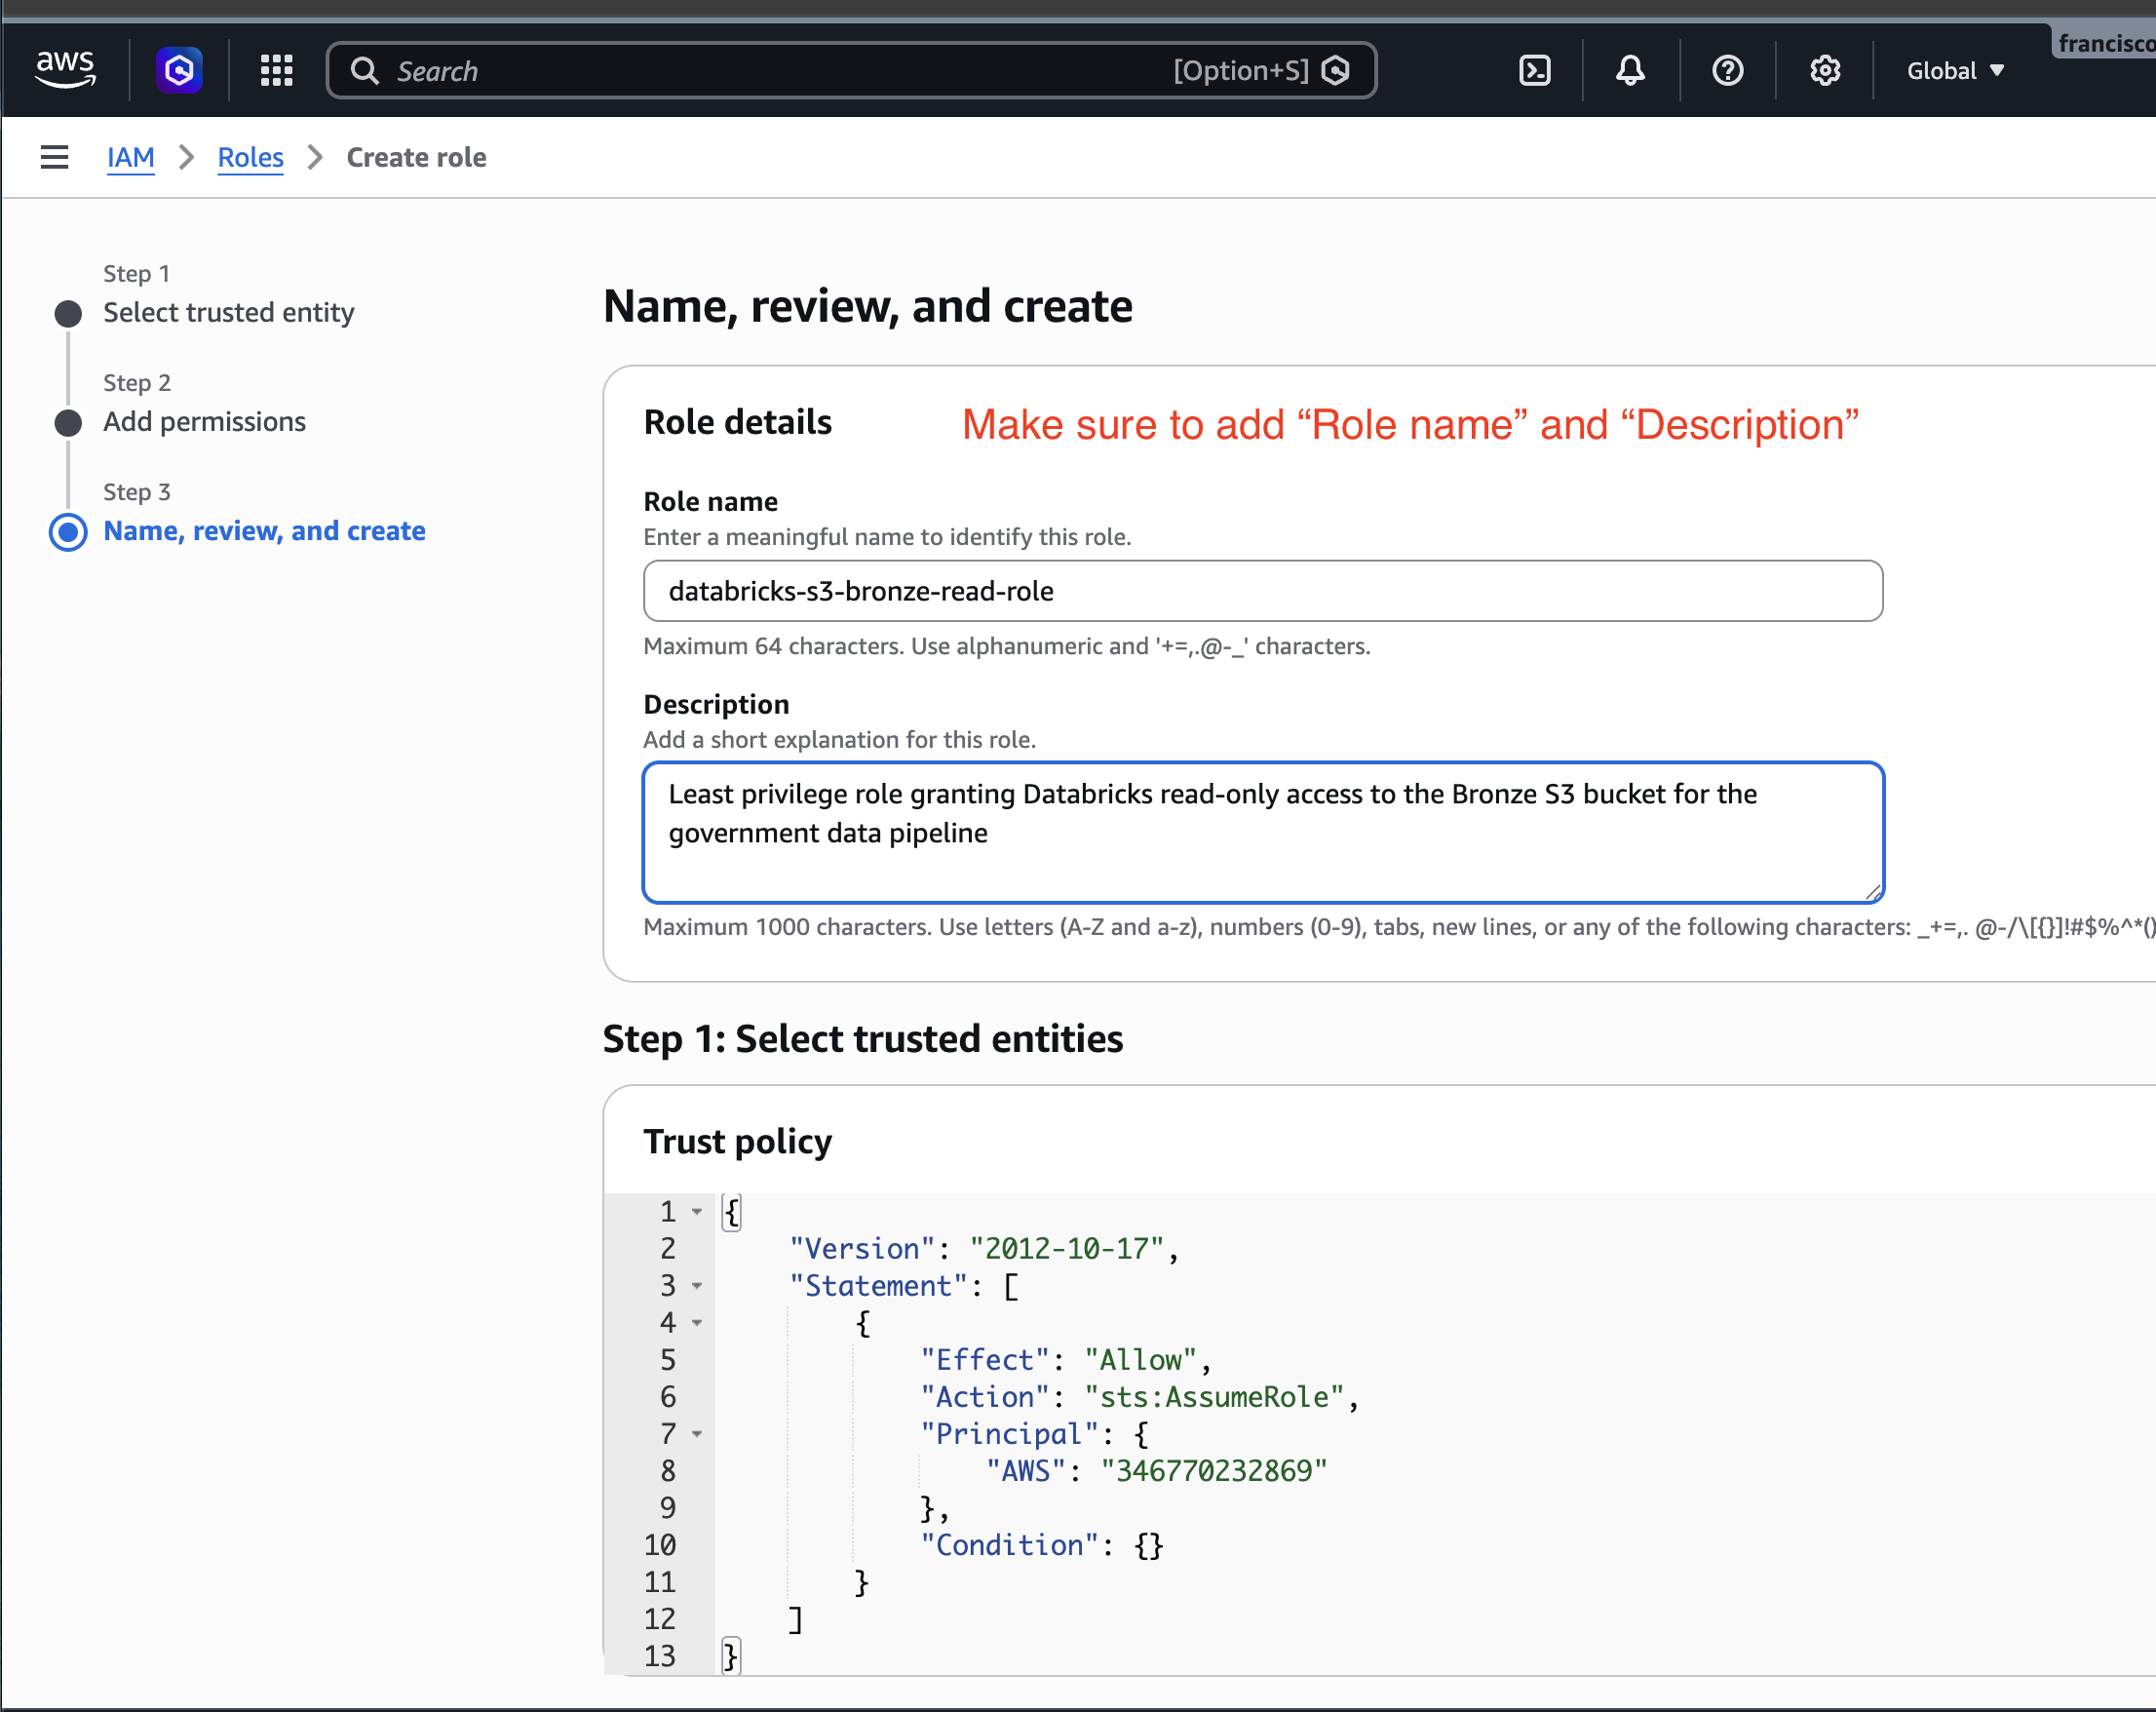
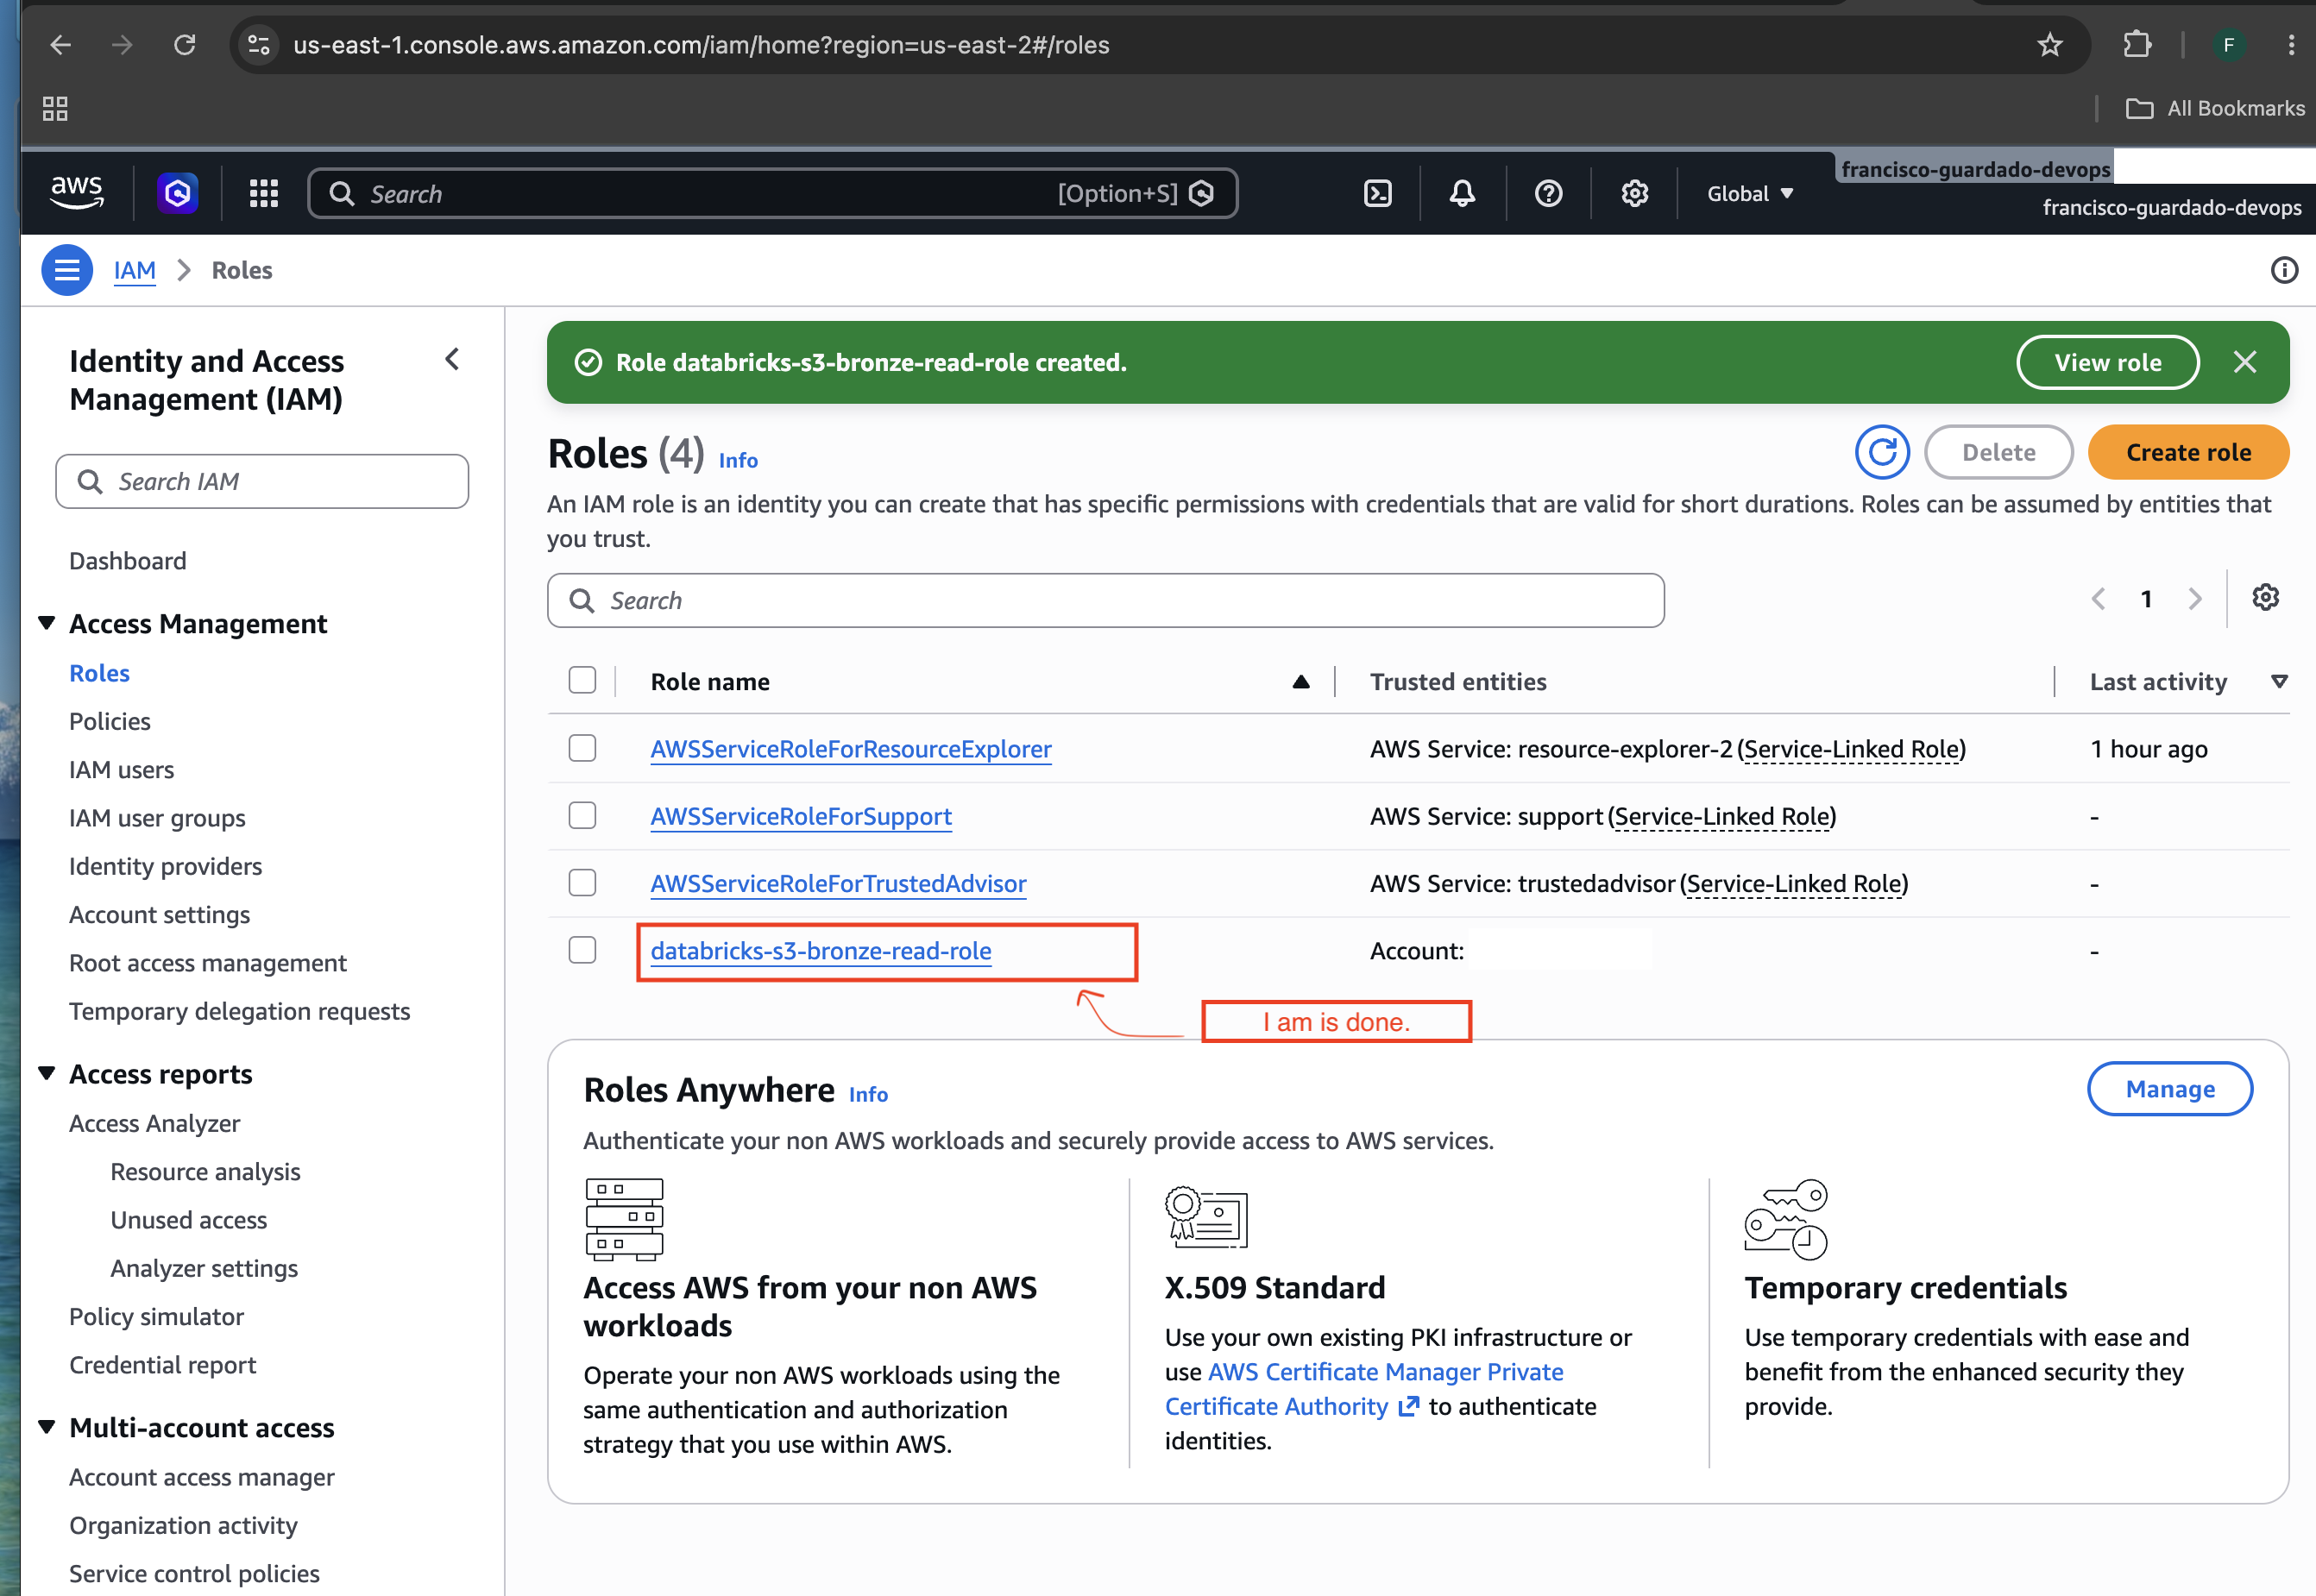
I am is done now
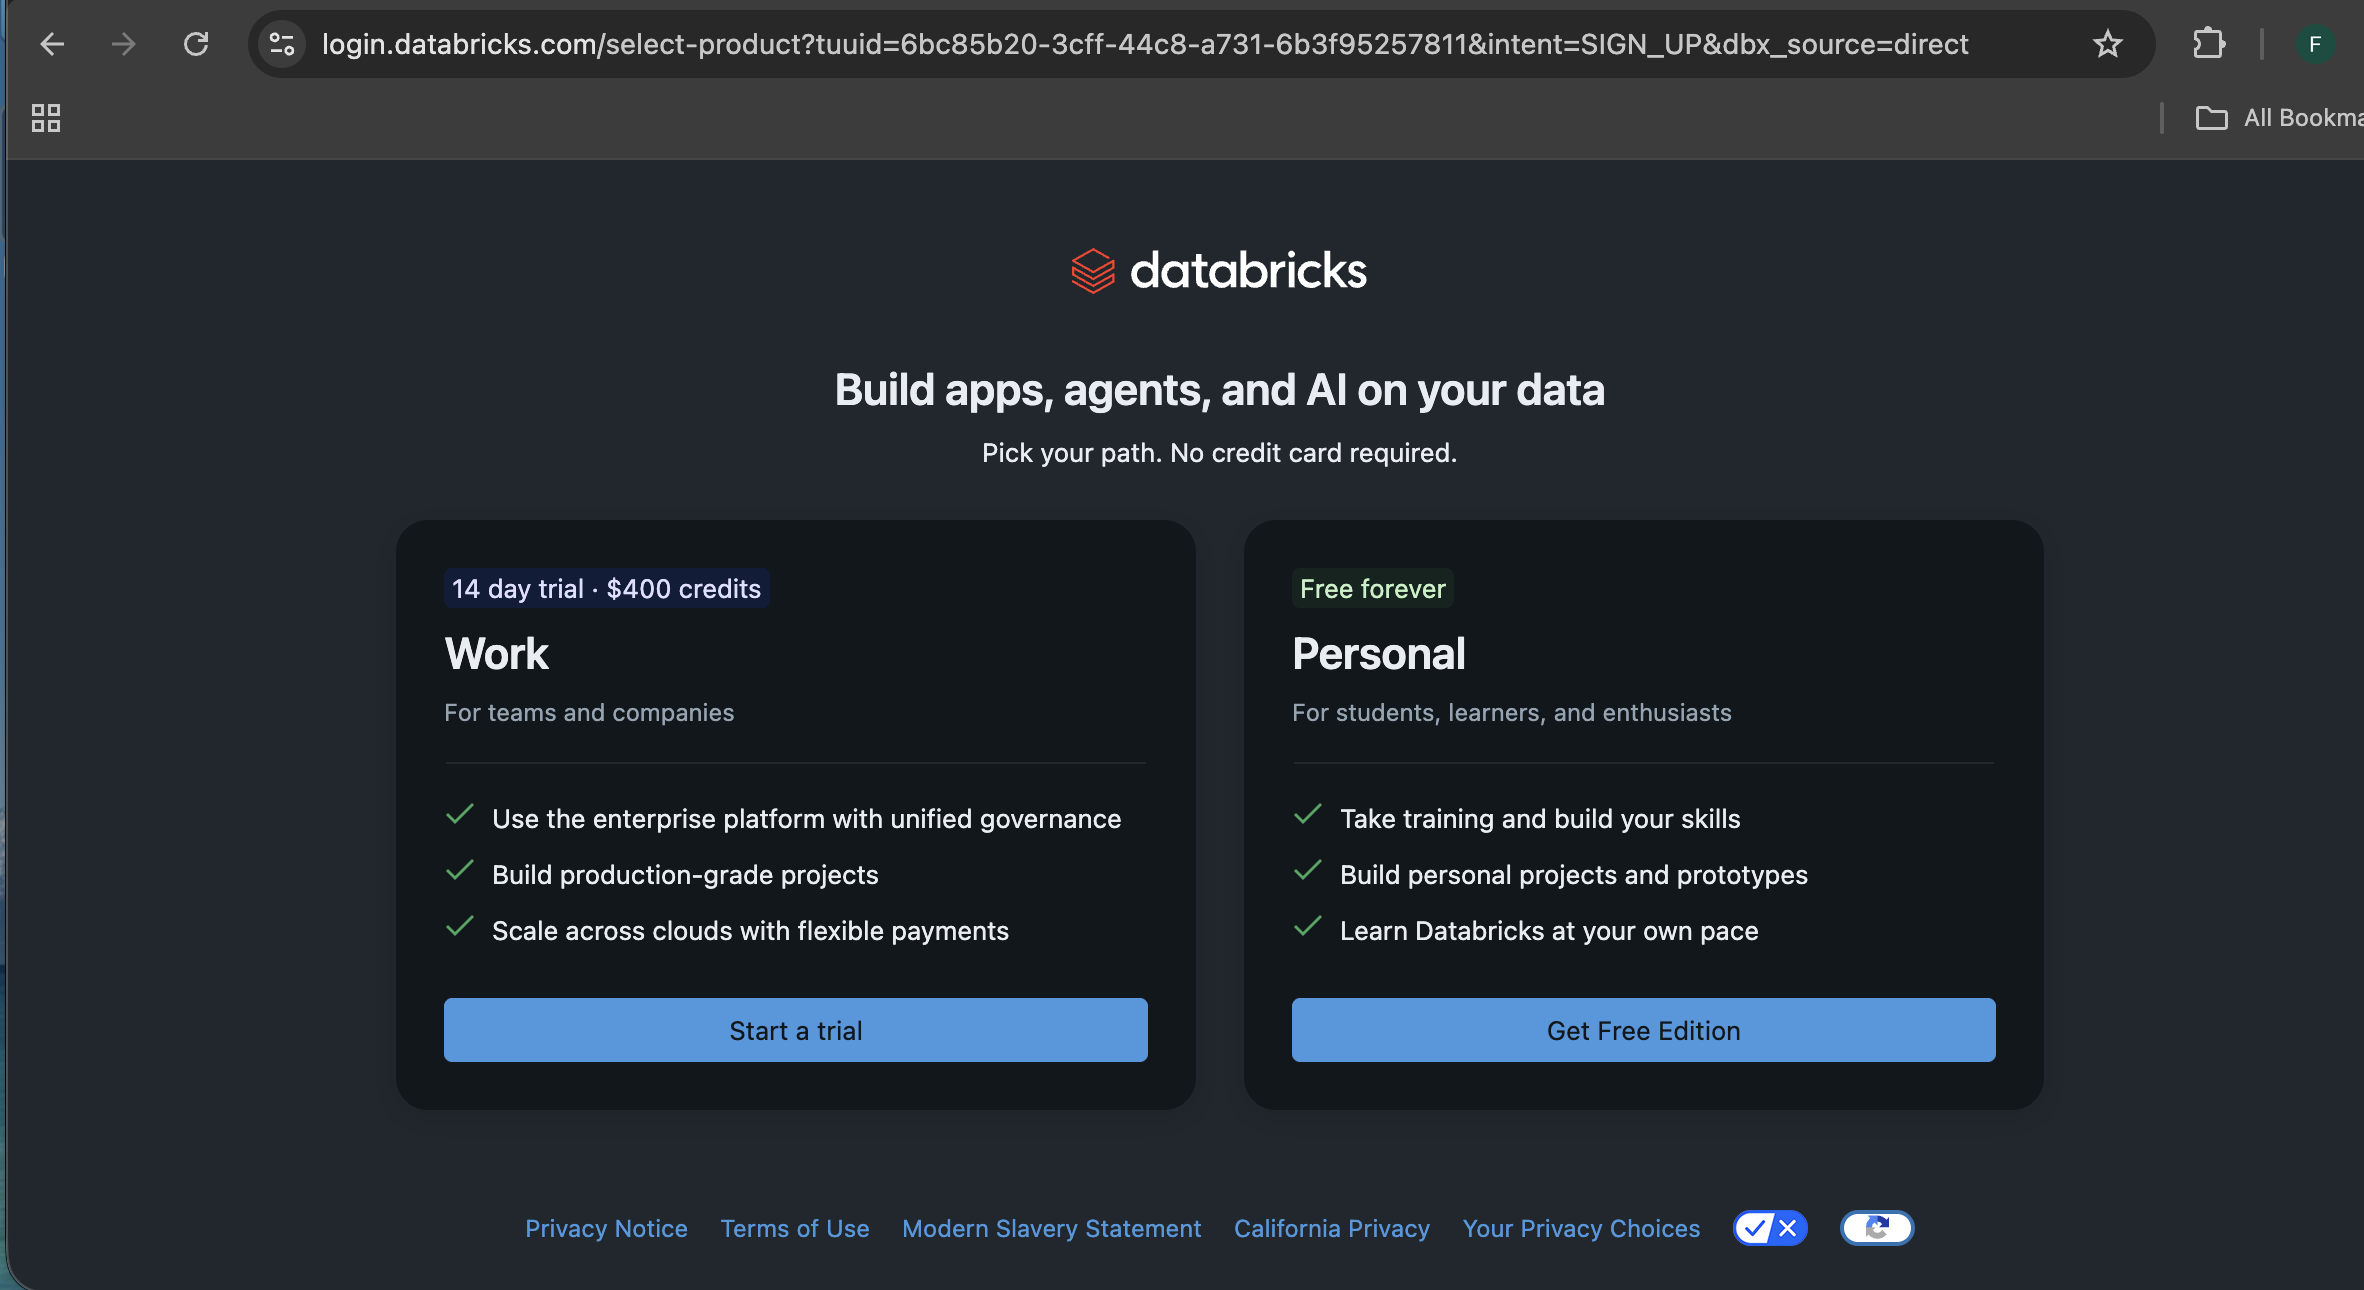
Now go to community.cloud.databricks.com and set up a Databrick account
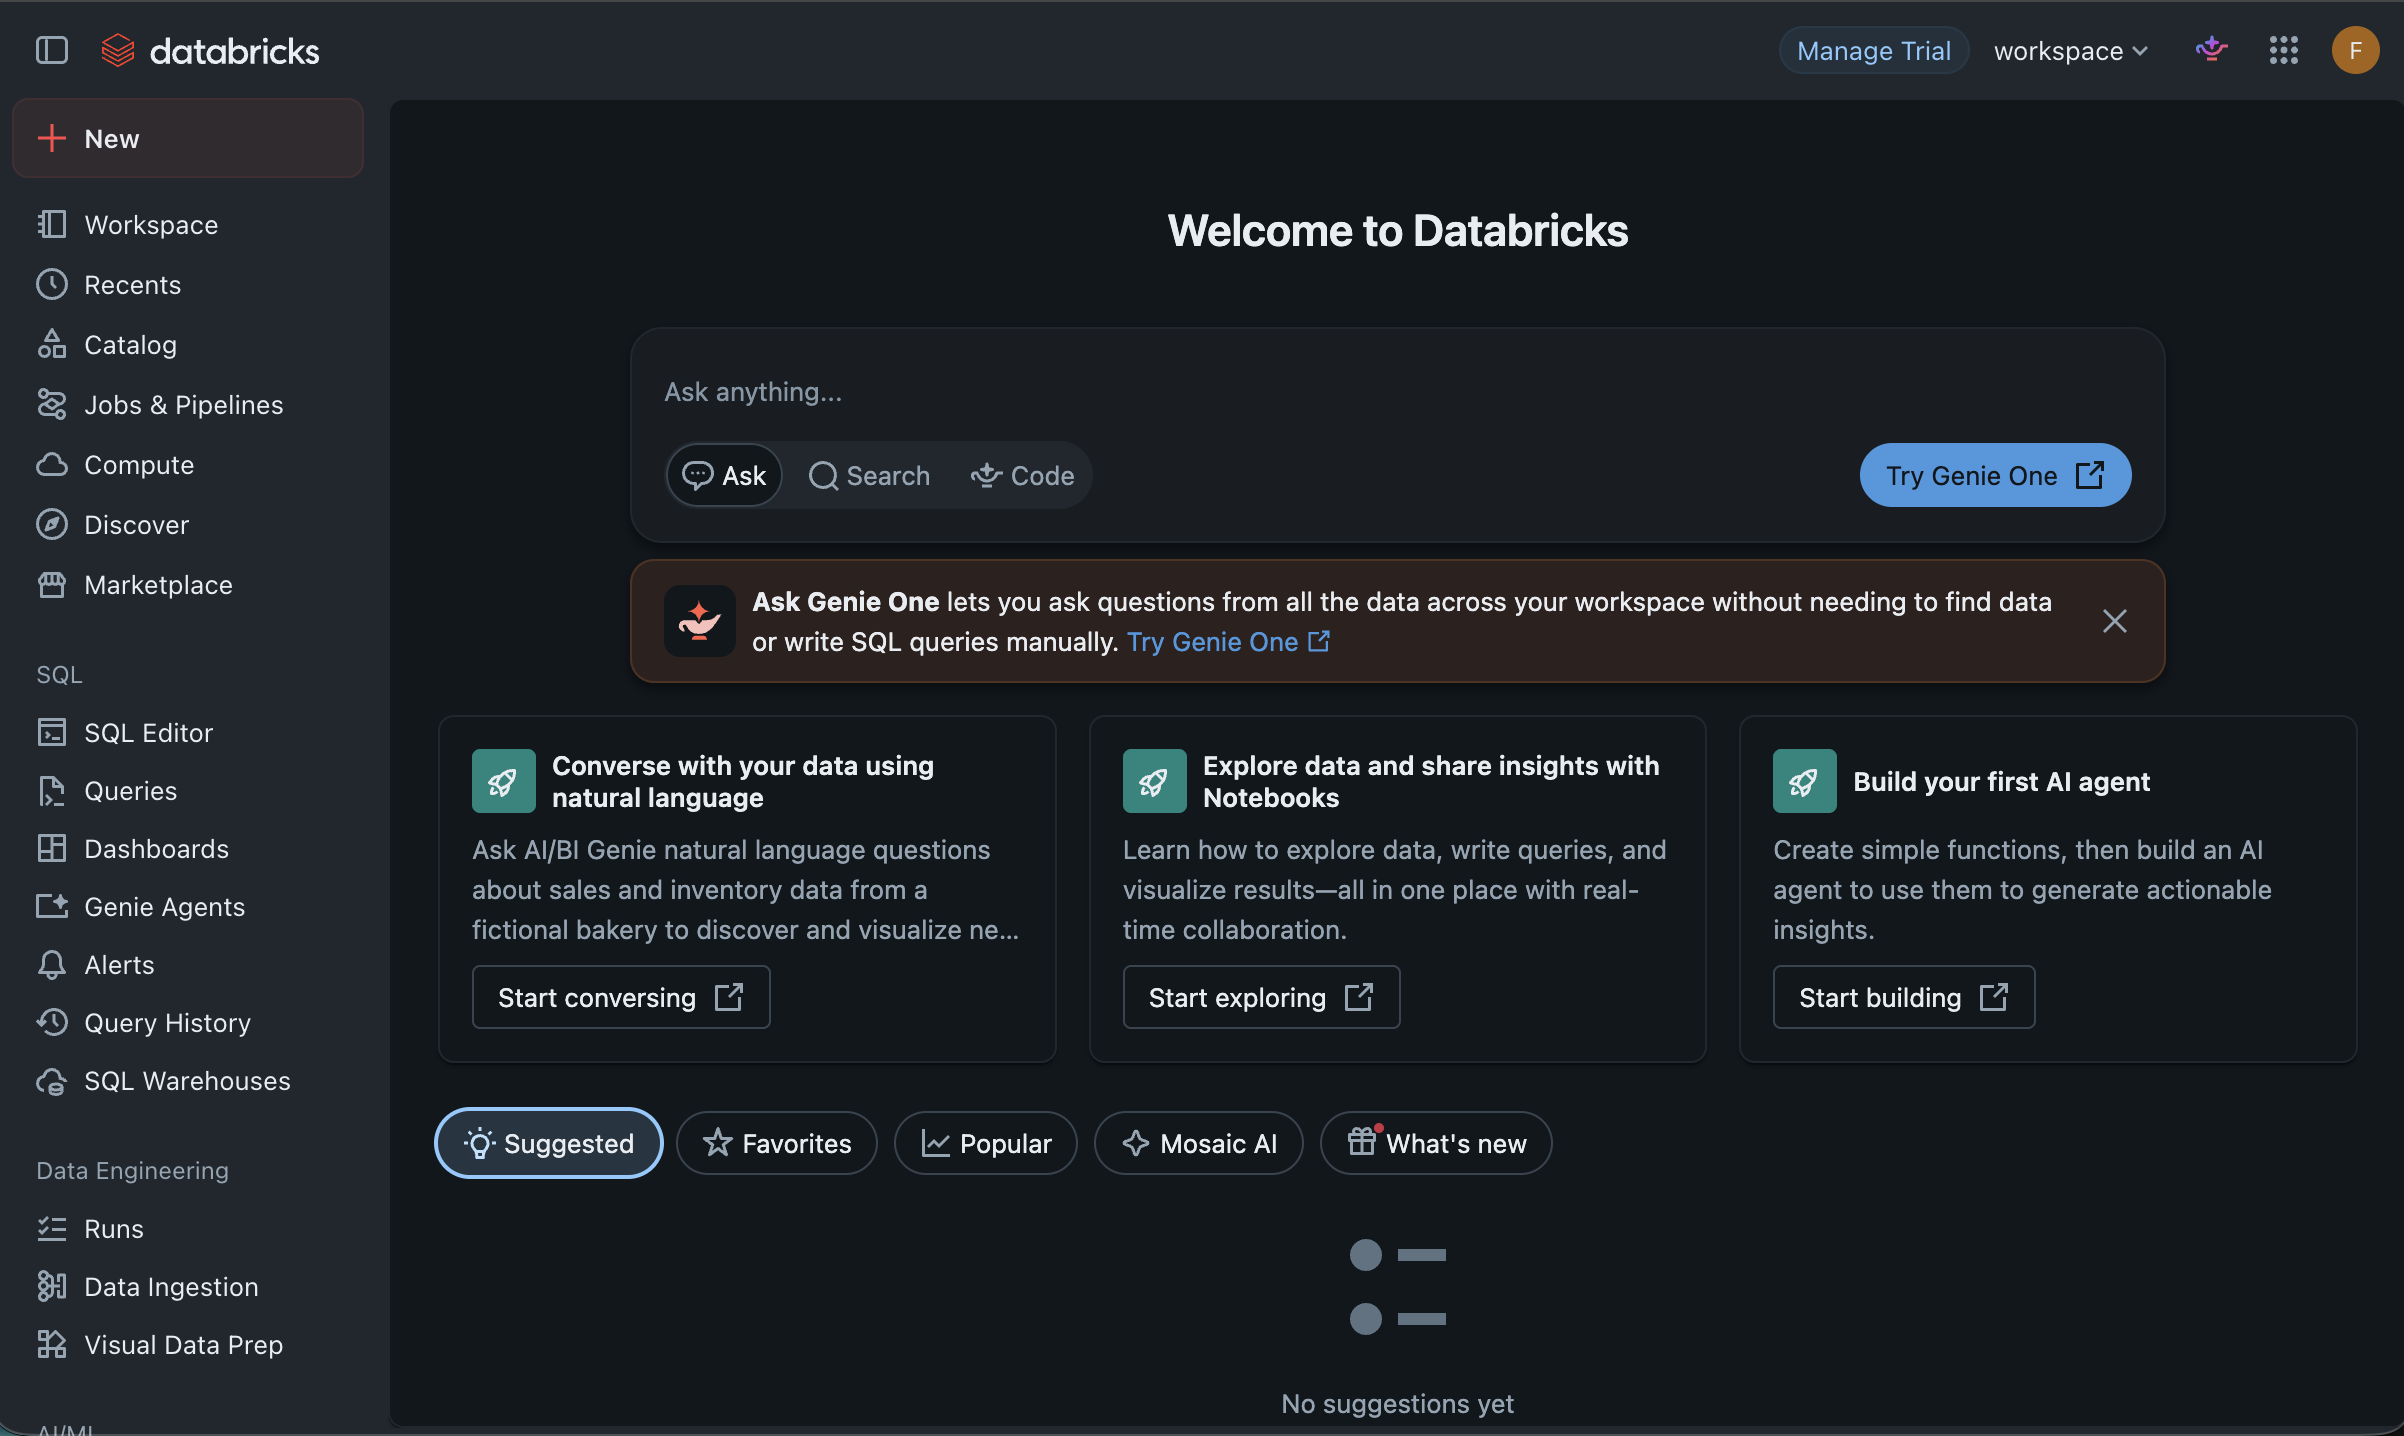
- Databricks workspace dashboard showing the full enterprise platform
- Left sidebar shows key capabilities: Catalog, Jobs and Pipelines, Compute, SQL Editor, Data Ingestion, Visual Data Prep
- The platform runs on AWS under the hood, connecting directly to our S3 Bronze bucket
- Databricks is the industry standard for Delta Lake, medallion architecture, and large-scale data engineering
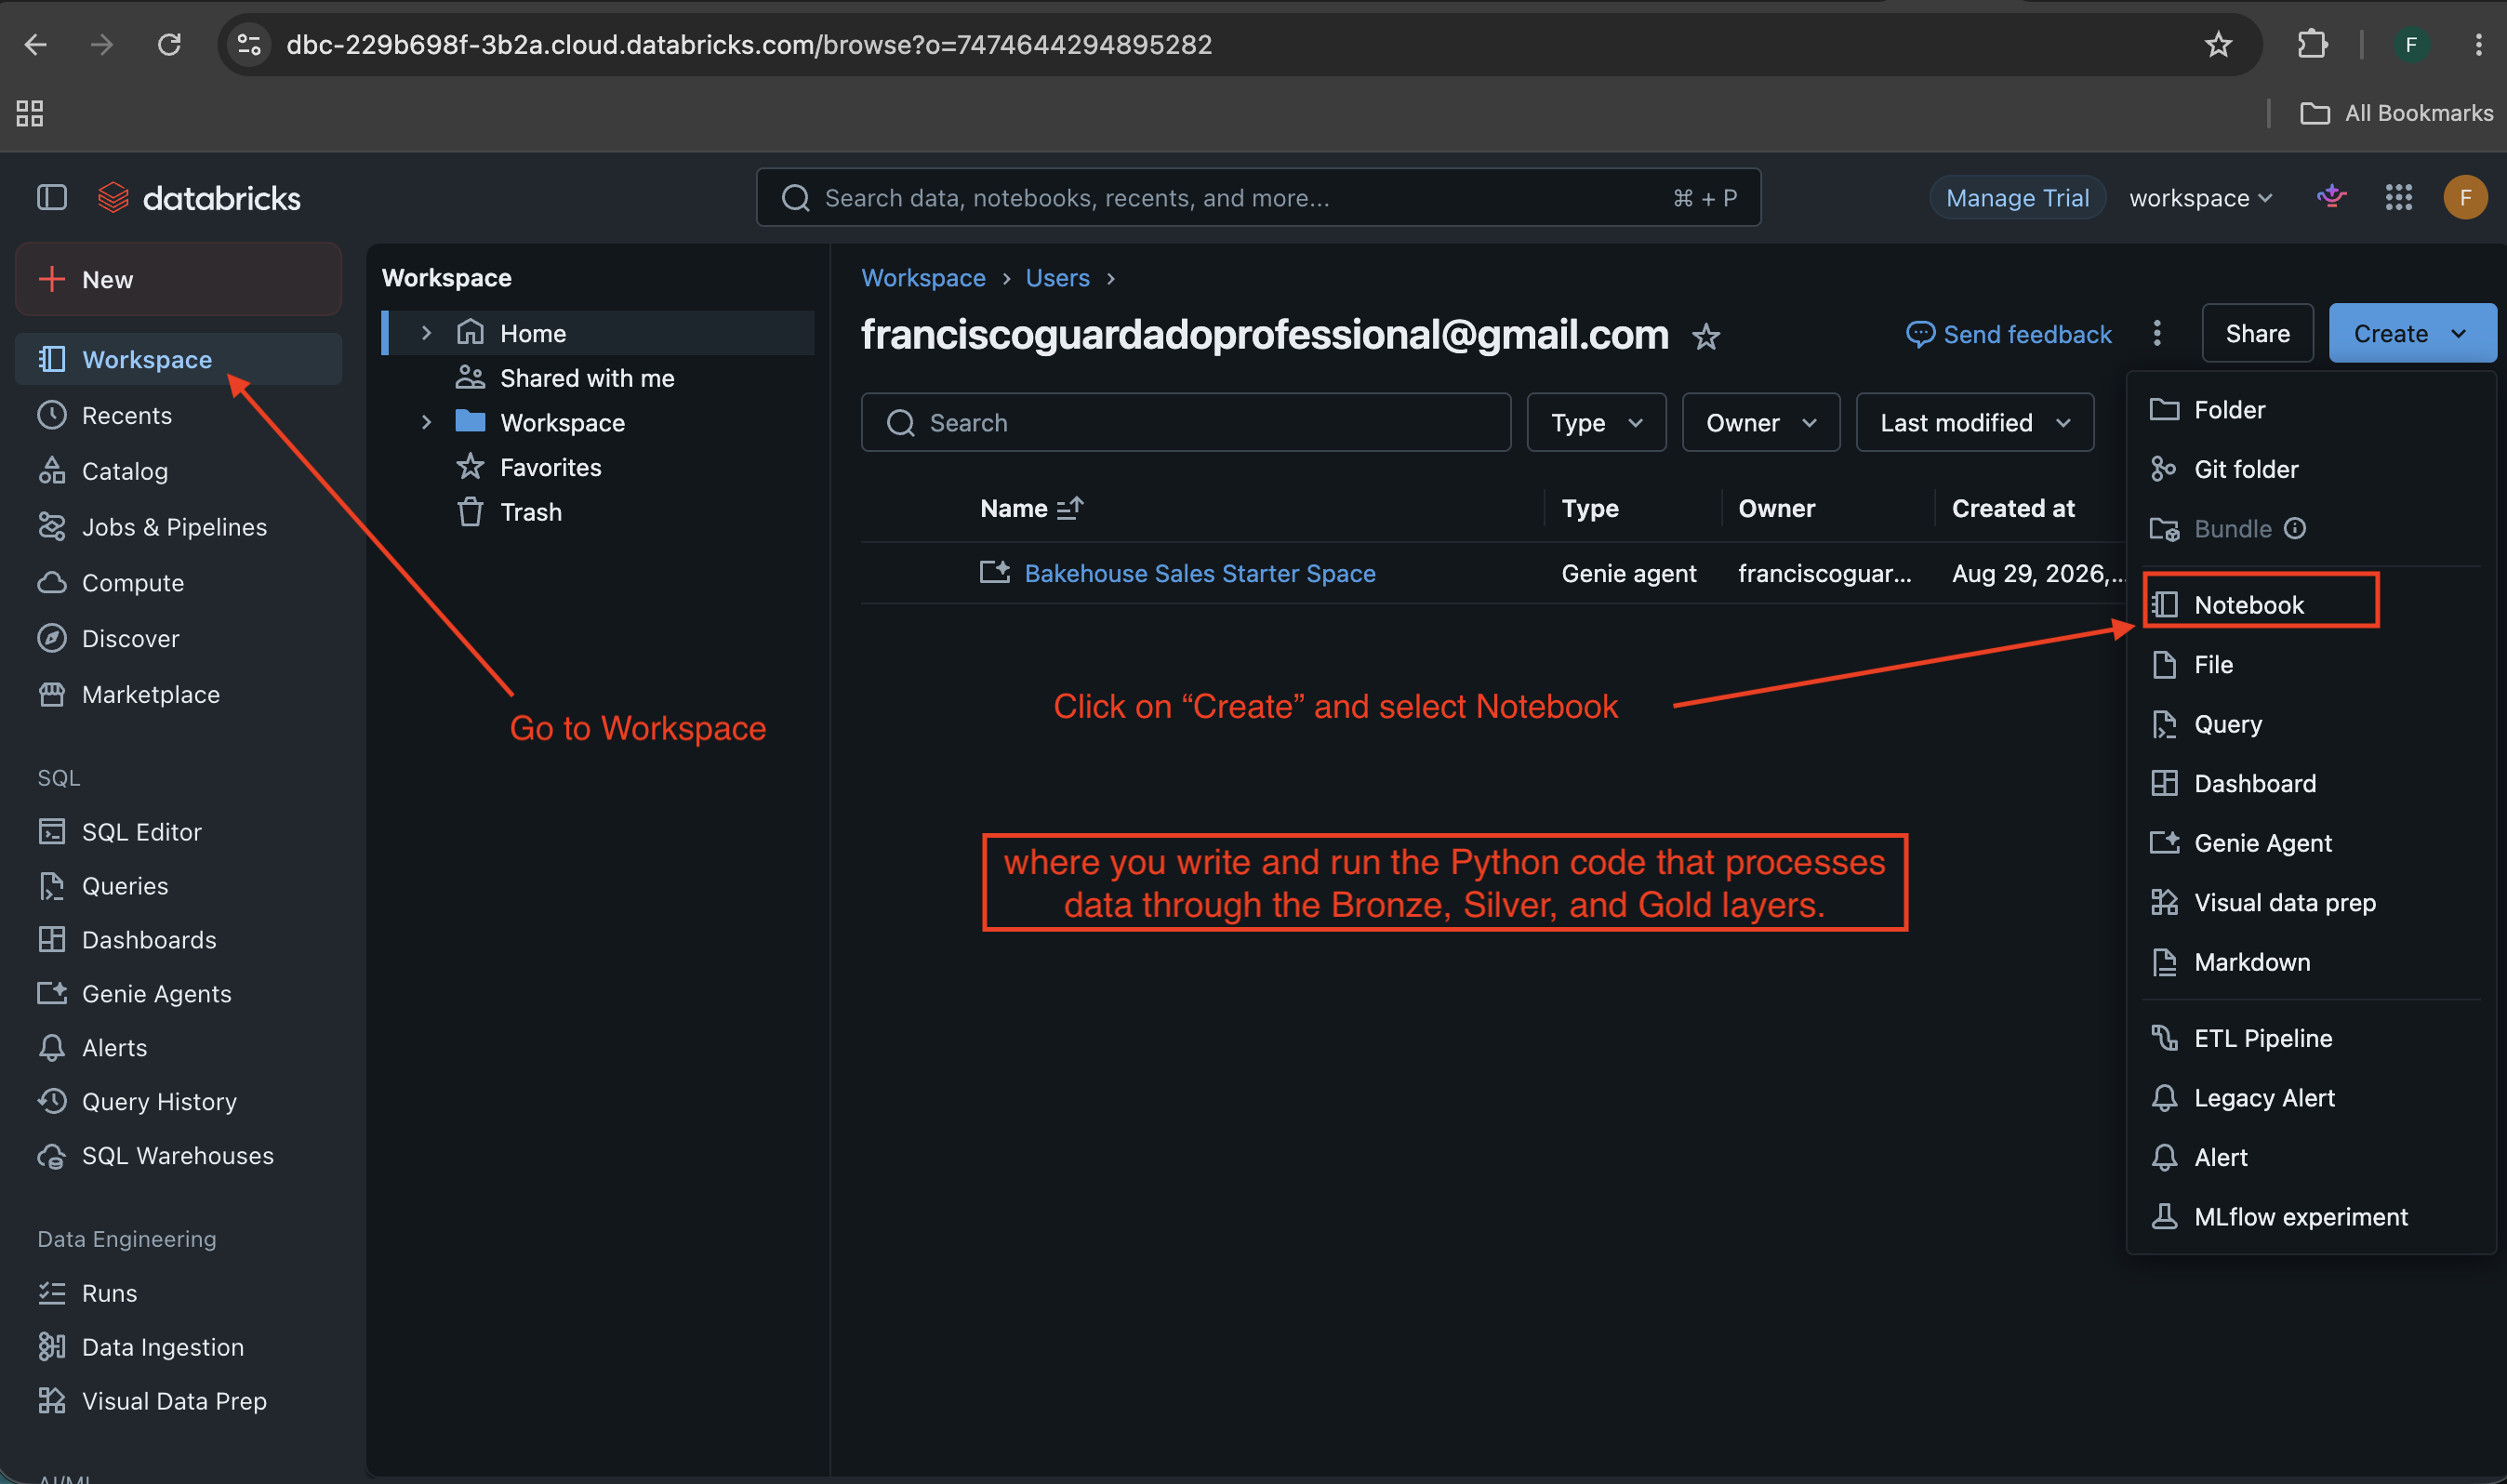
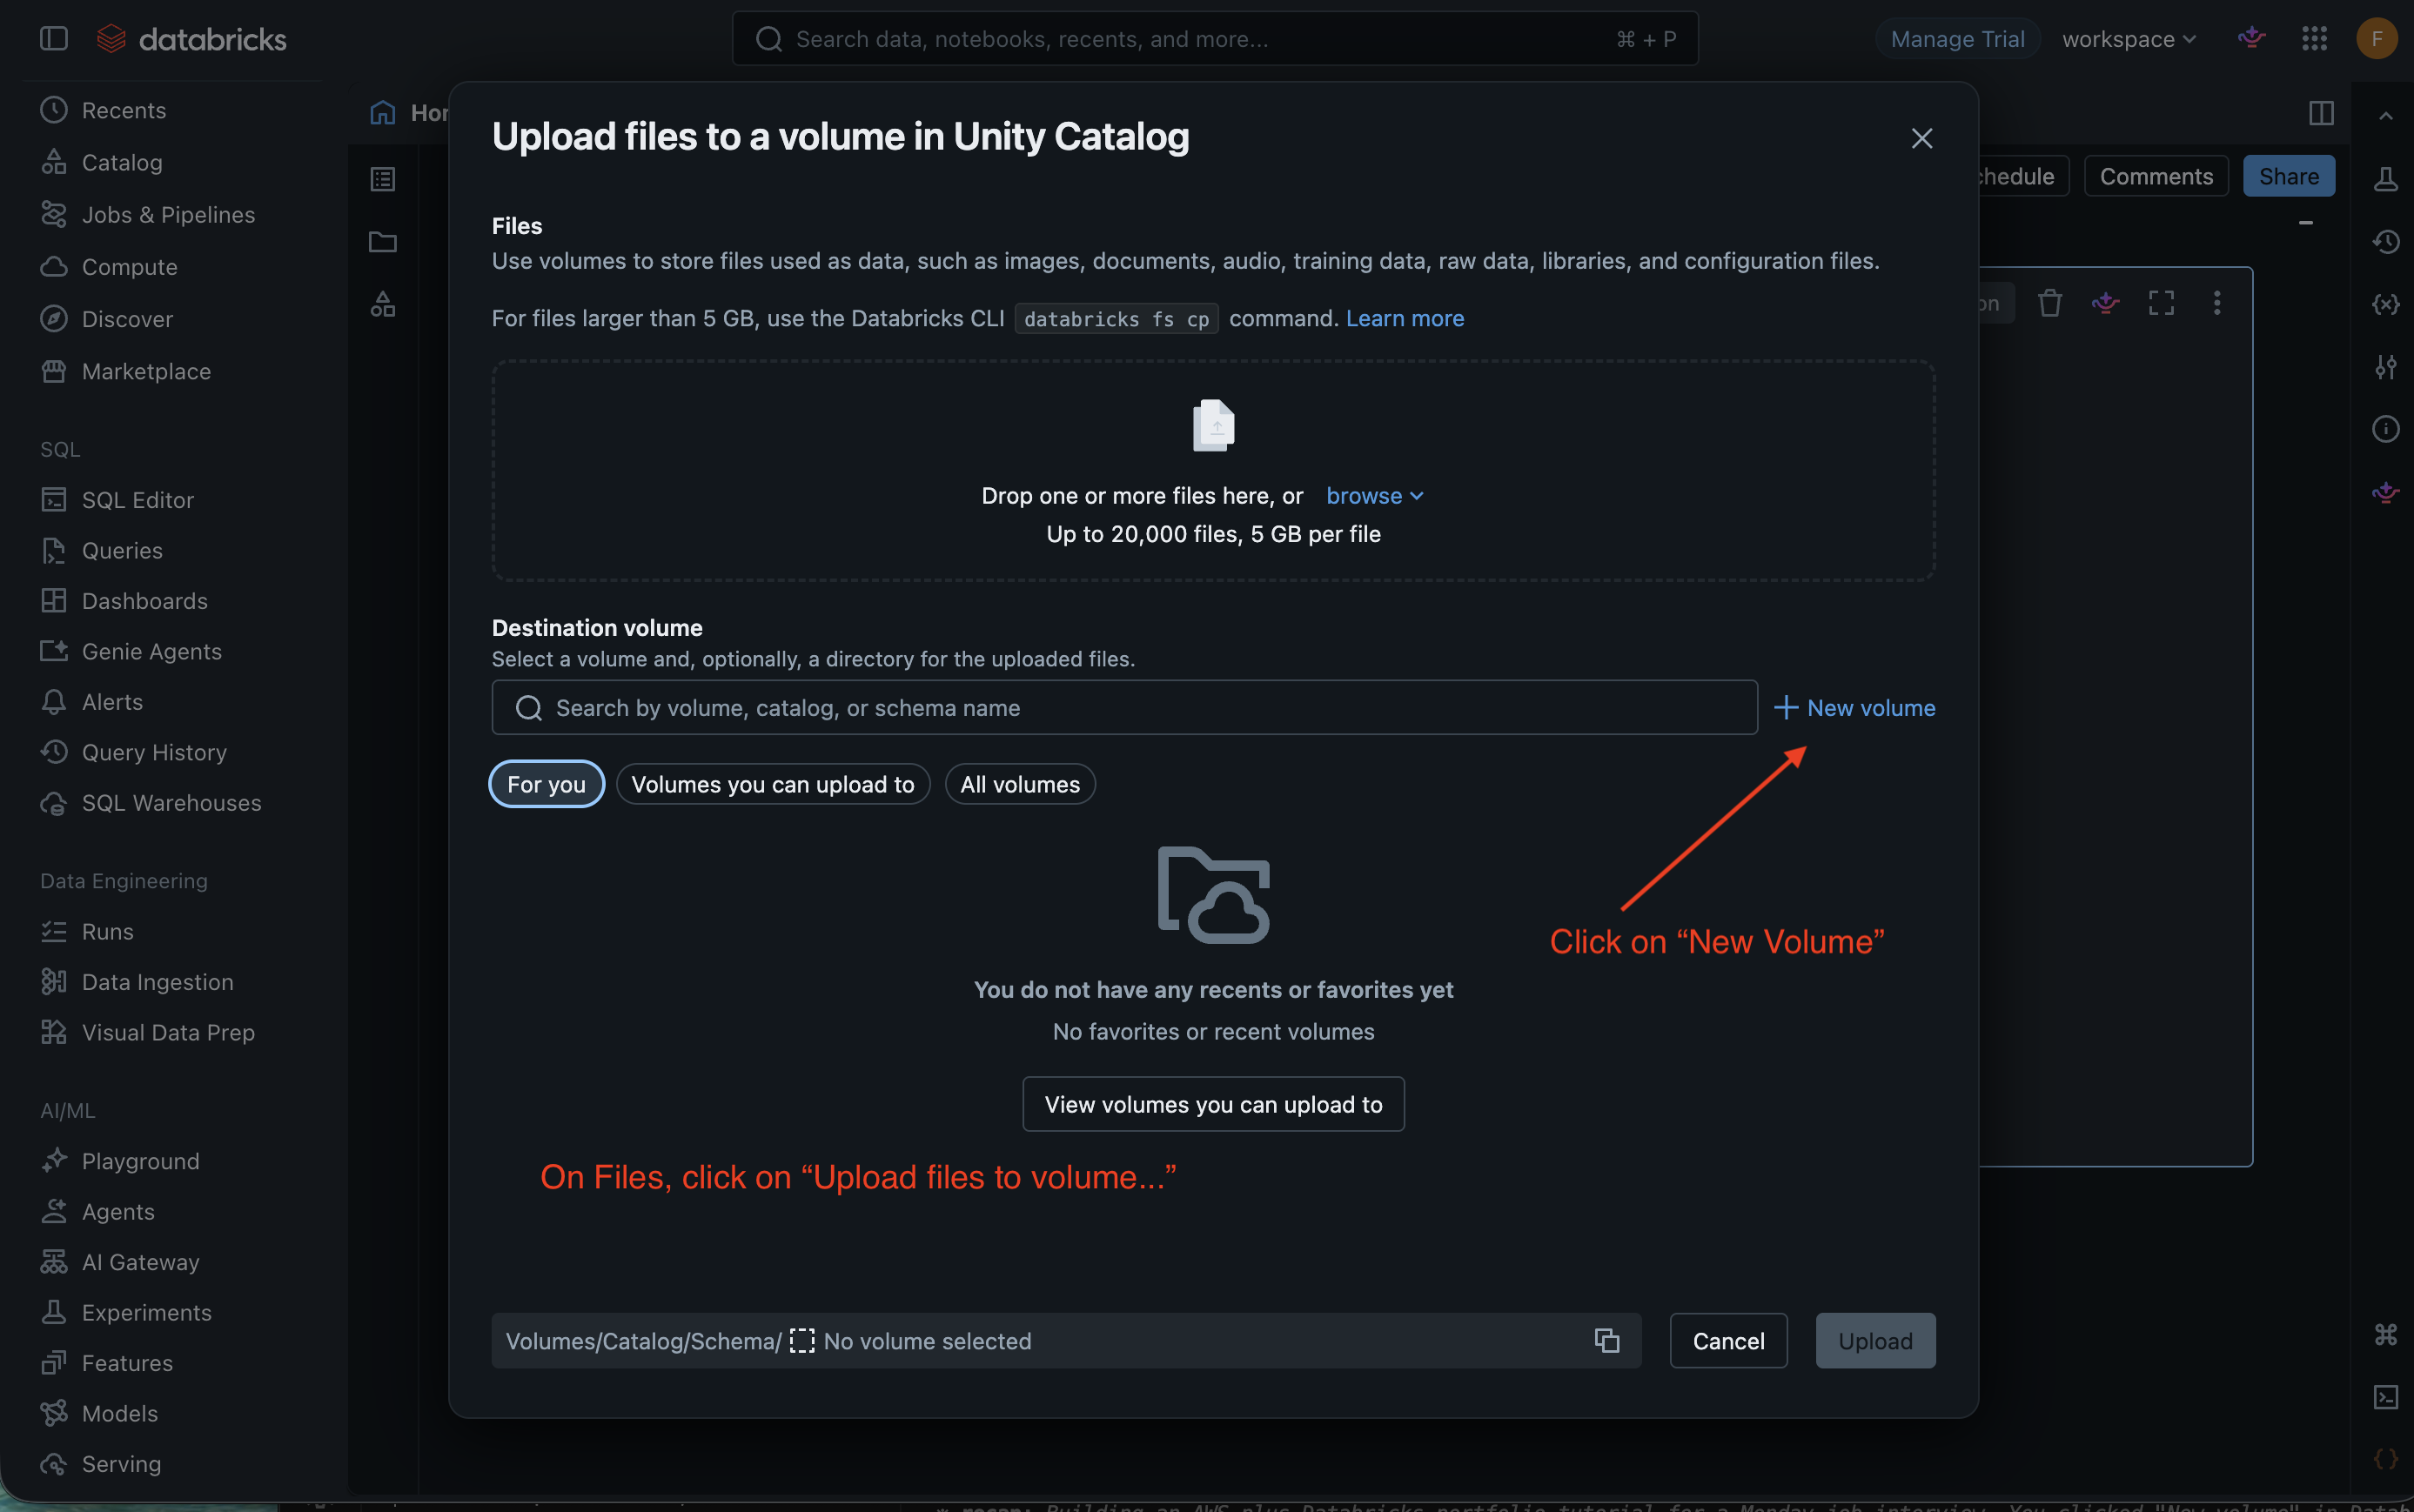
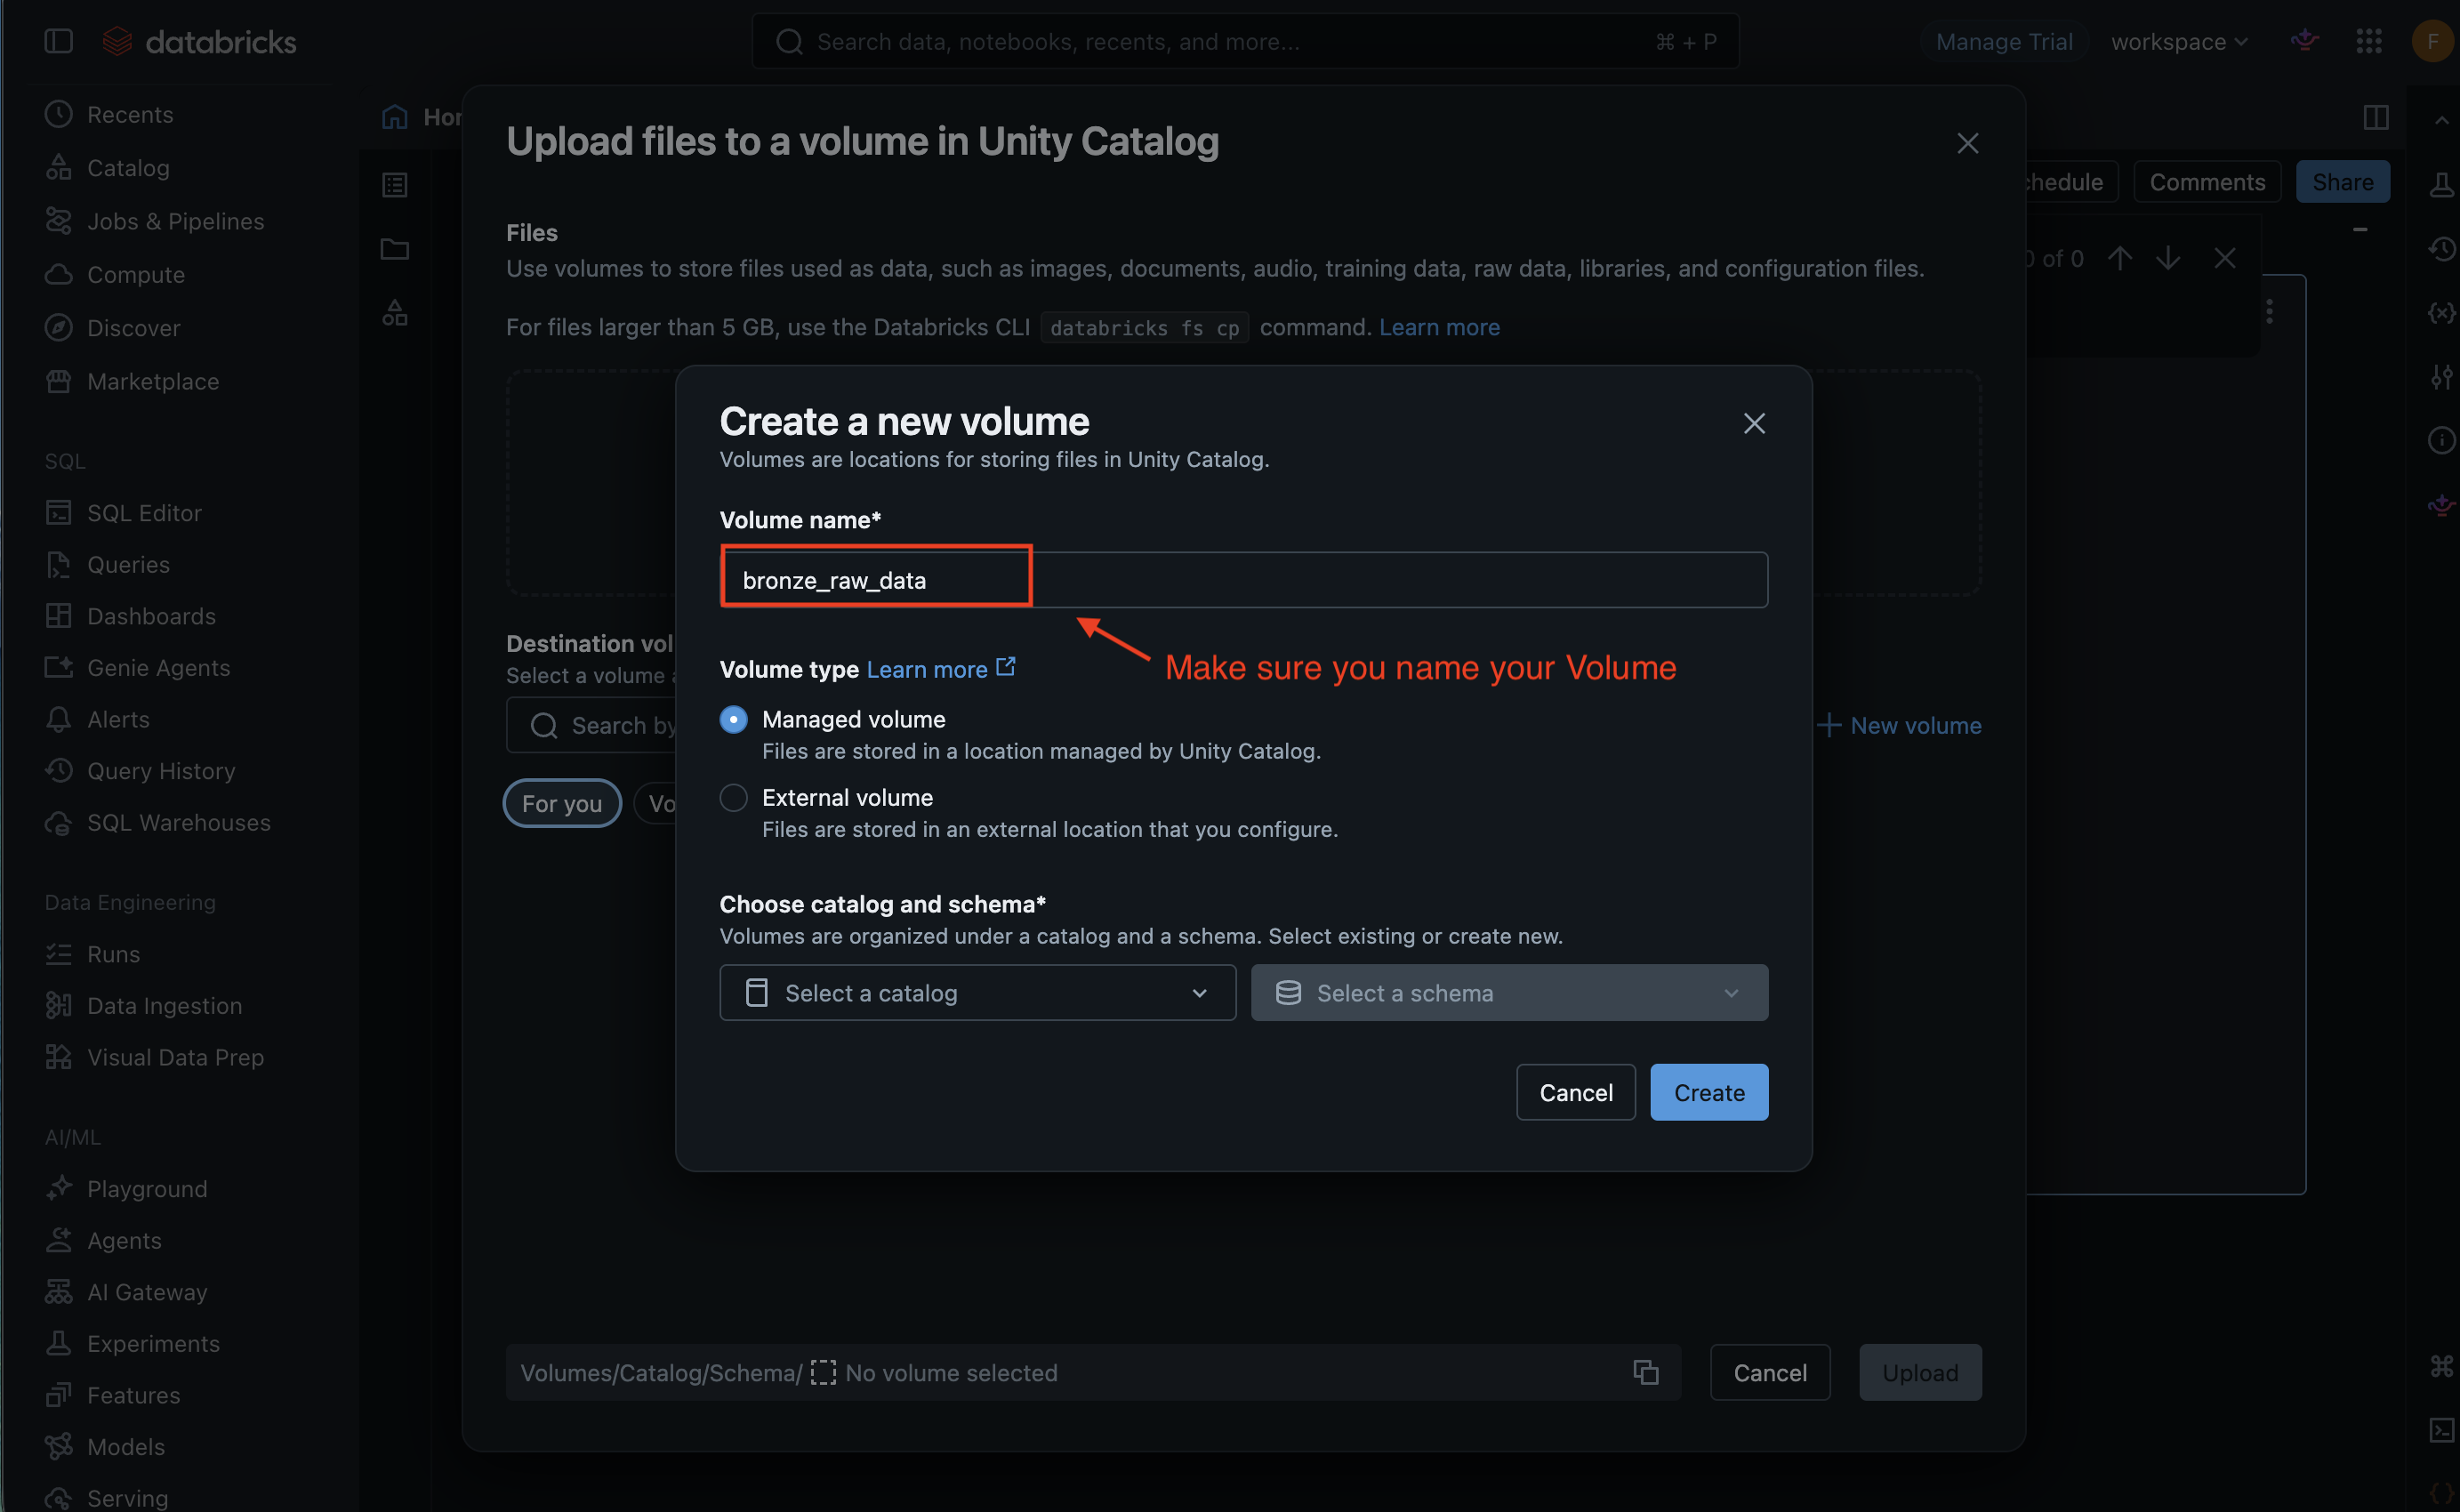
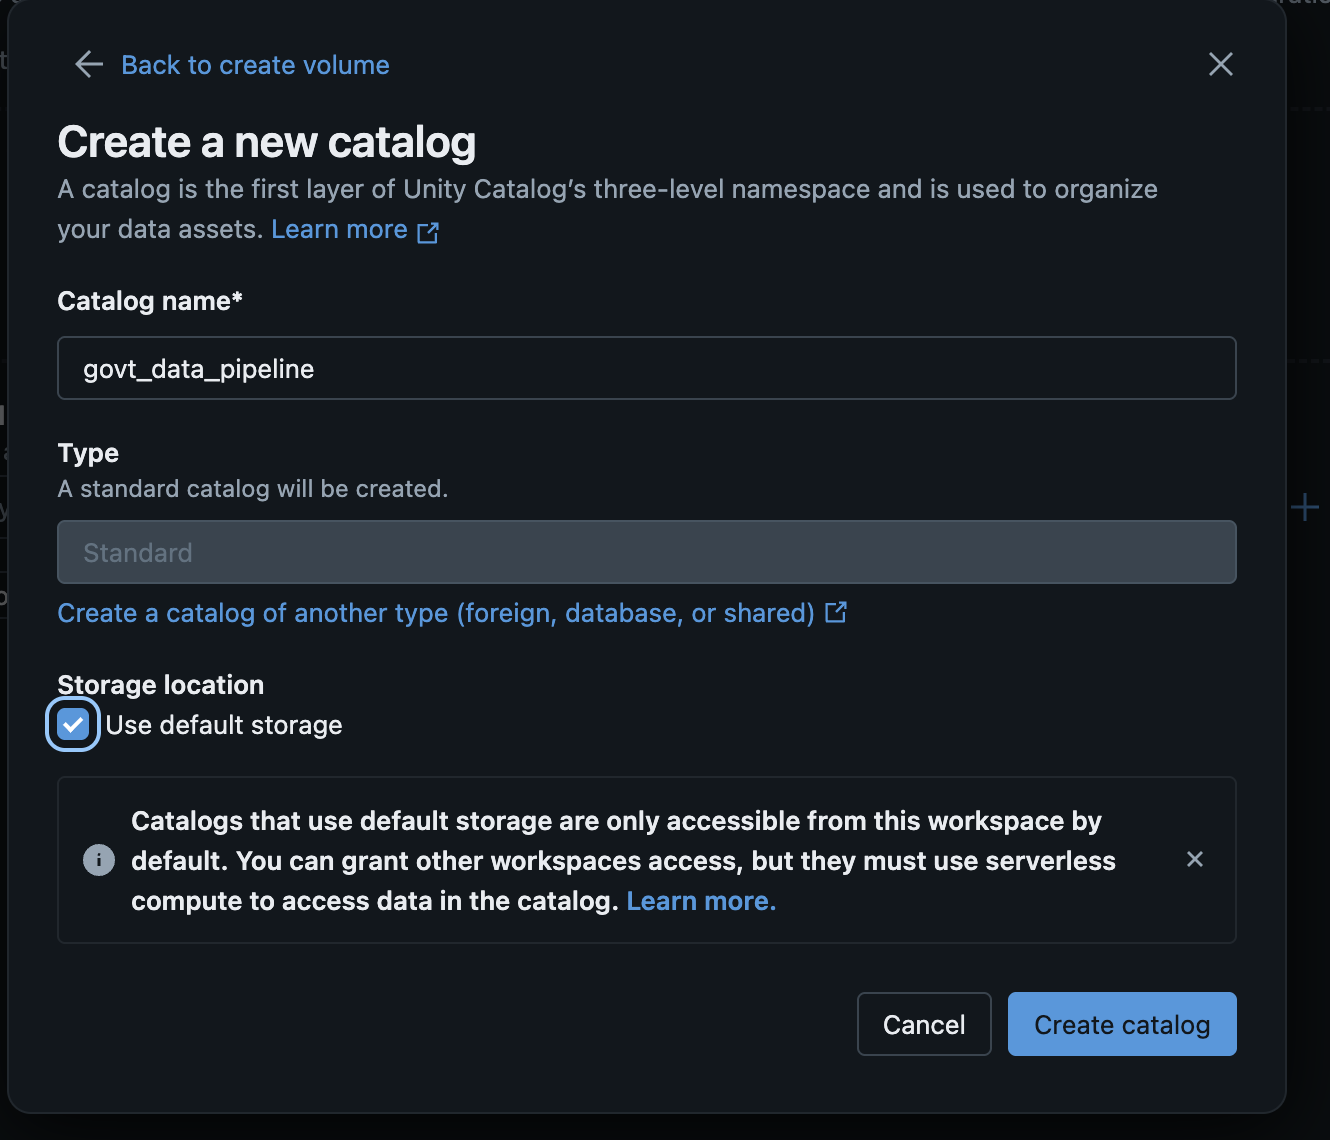
Make sure to fill in the fields:
Catalog name: govt_data_pipeline
Type: keep Standard
Storage location: check the "Use default storage" checkbox
Then click "Create catalog".
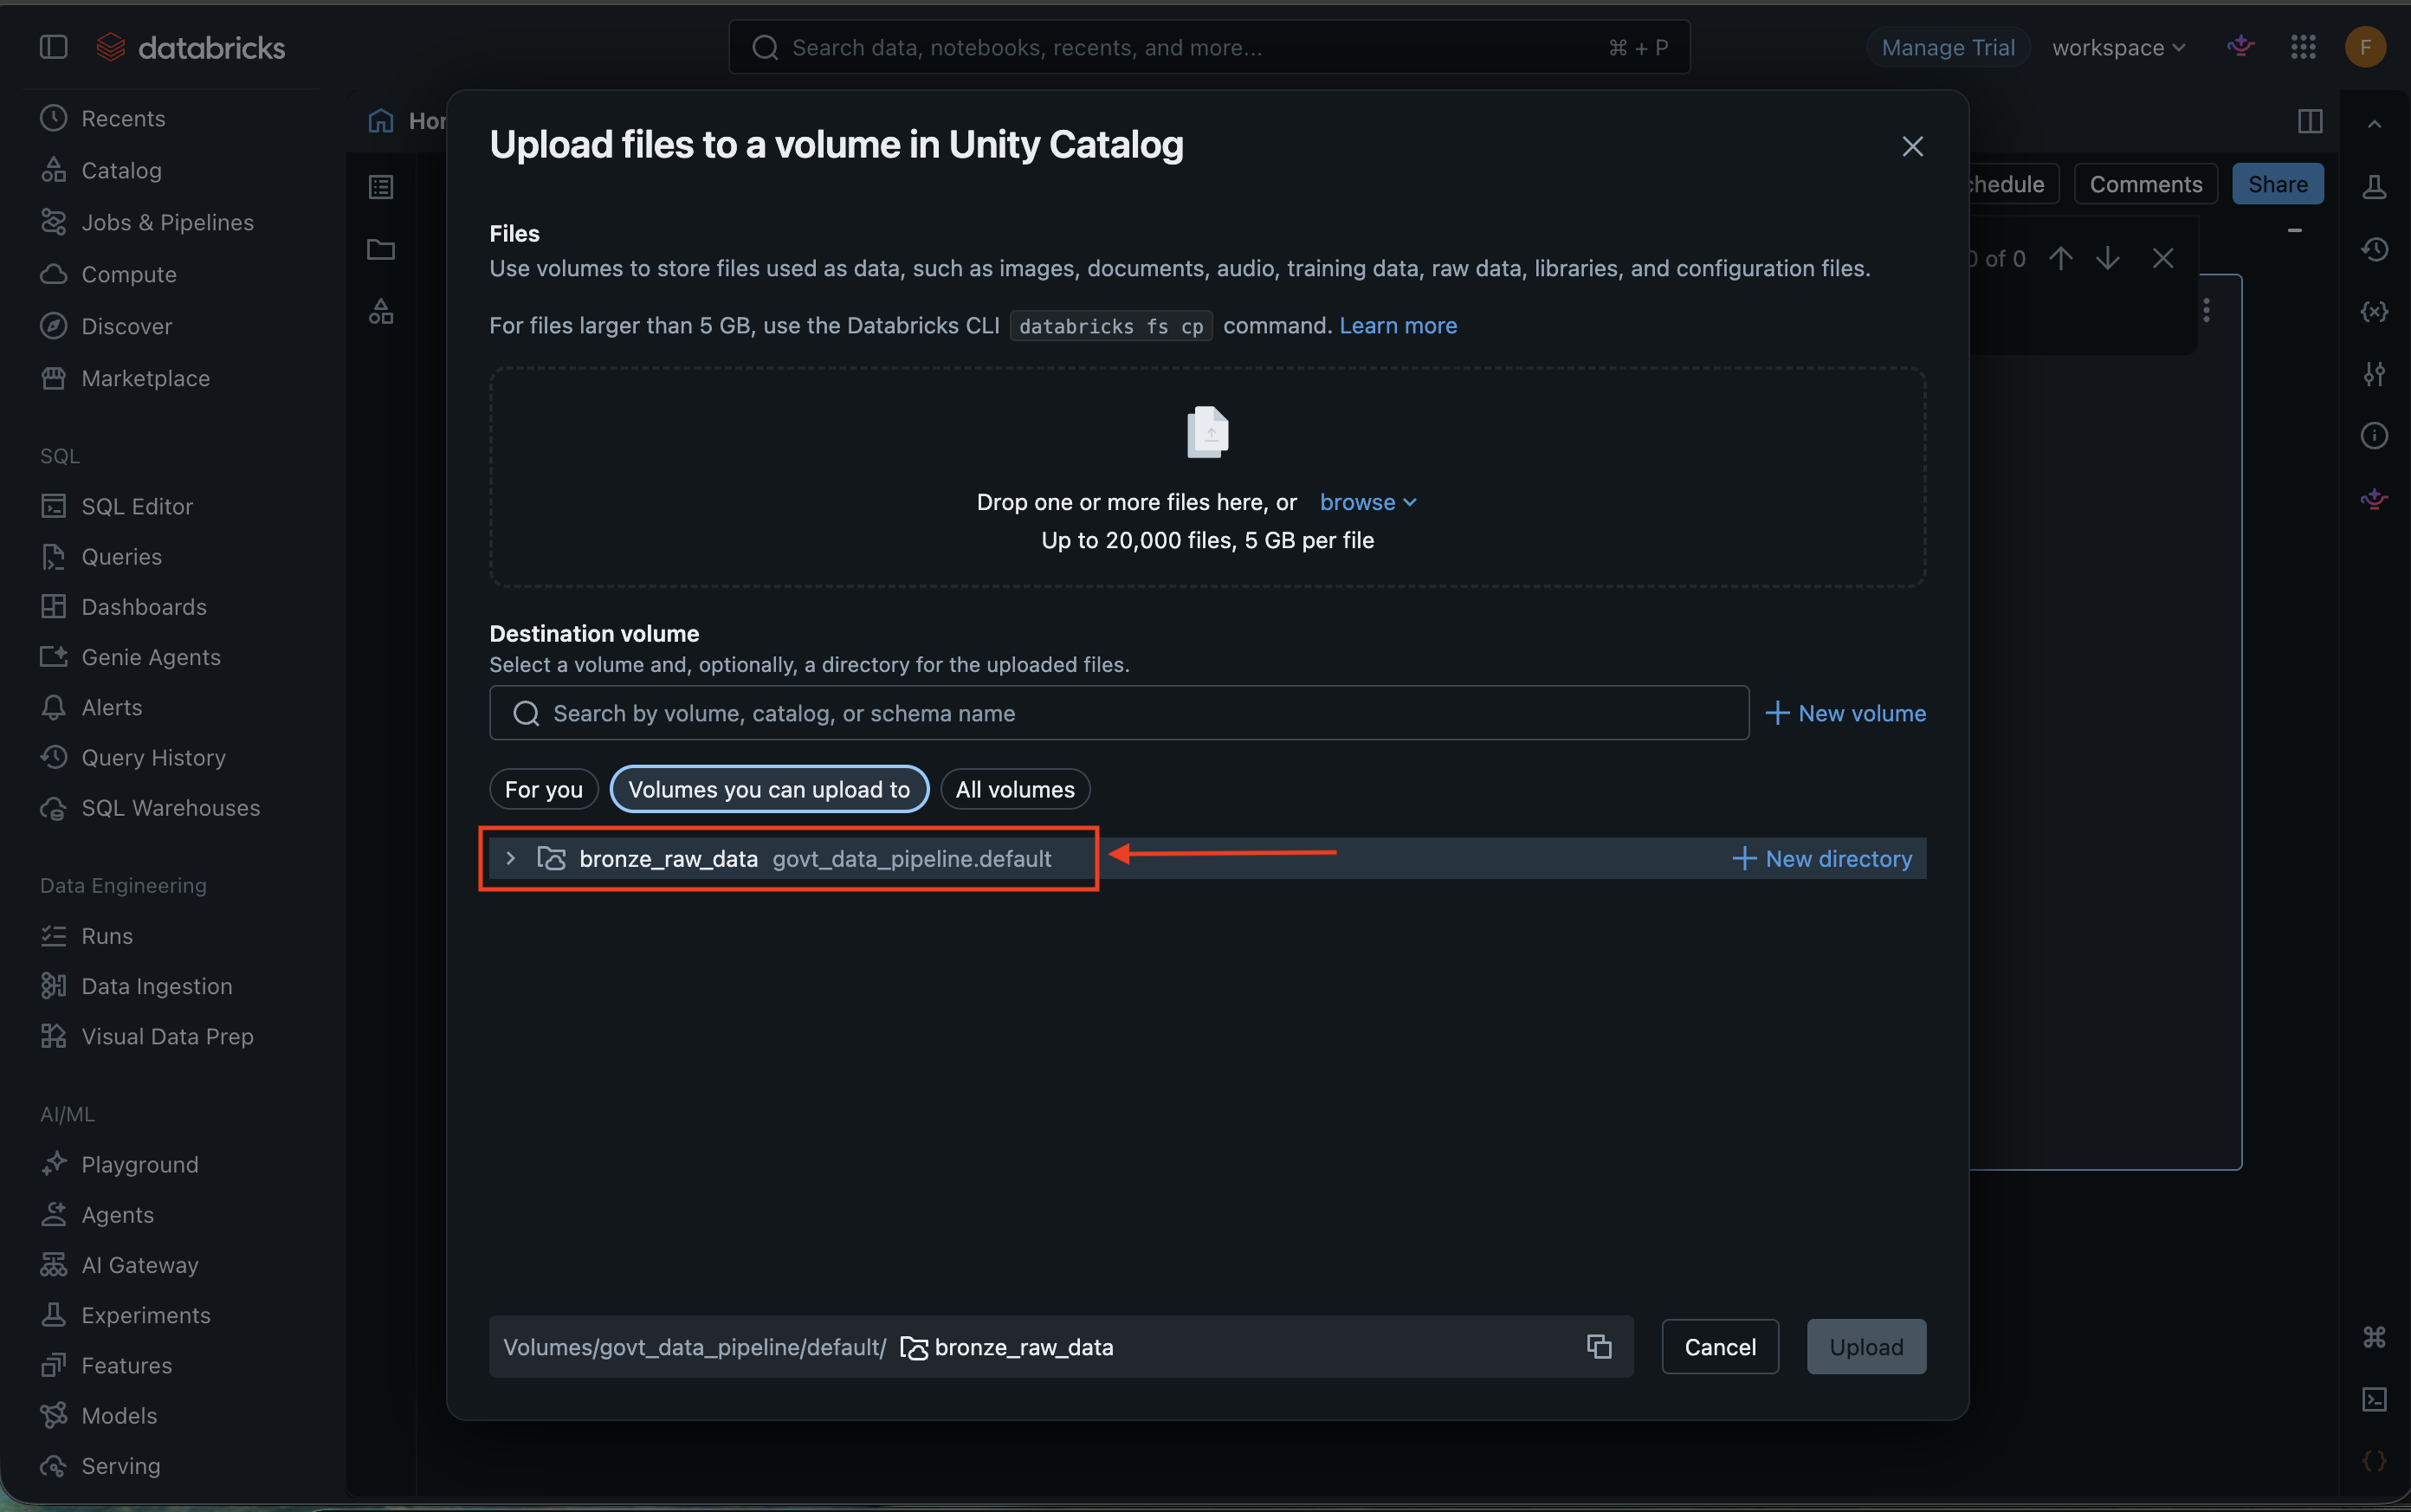
- Volume bronze_raw_data created under govt_data_pipeline.default
- The full path at the bottom: Volumes/govt_data_pipeline/default/bronze_raw_data
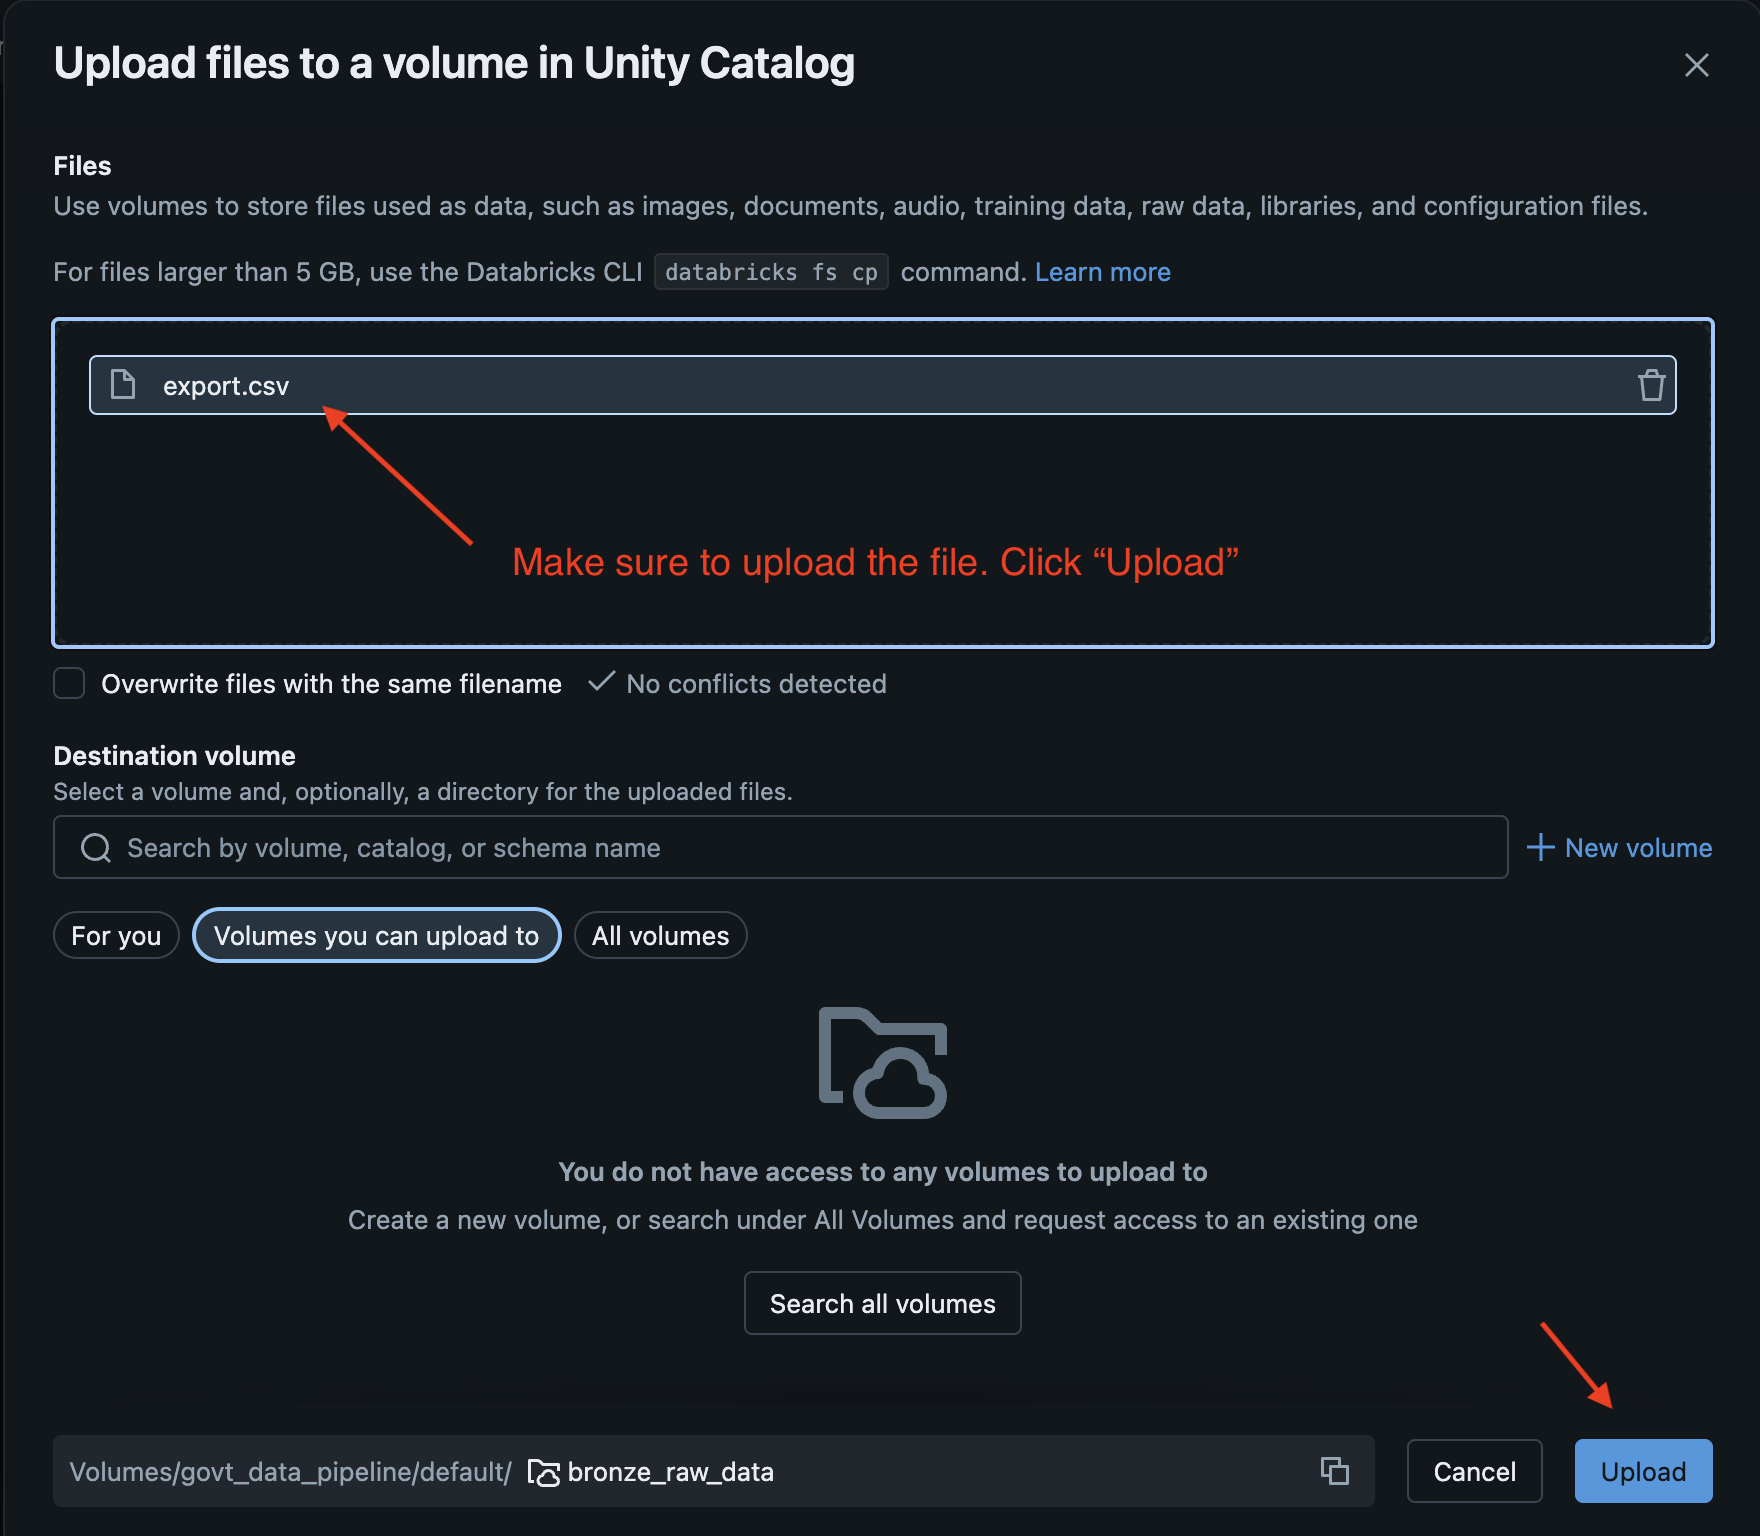
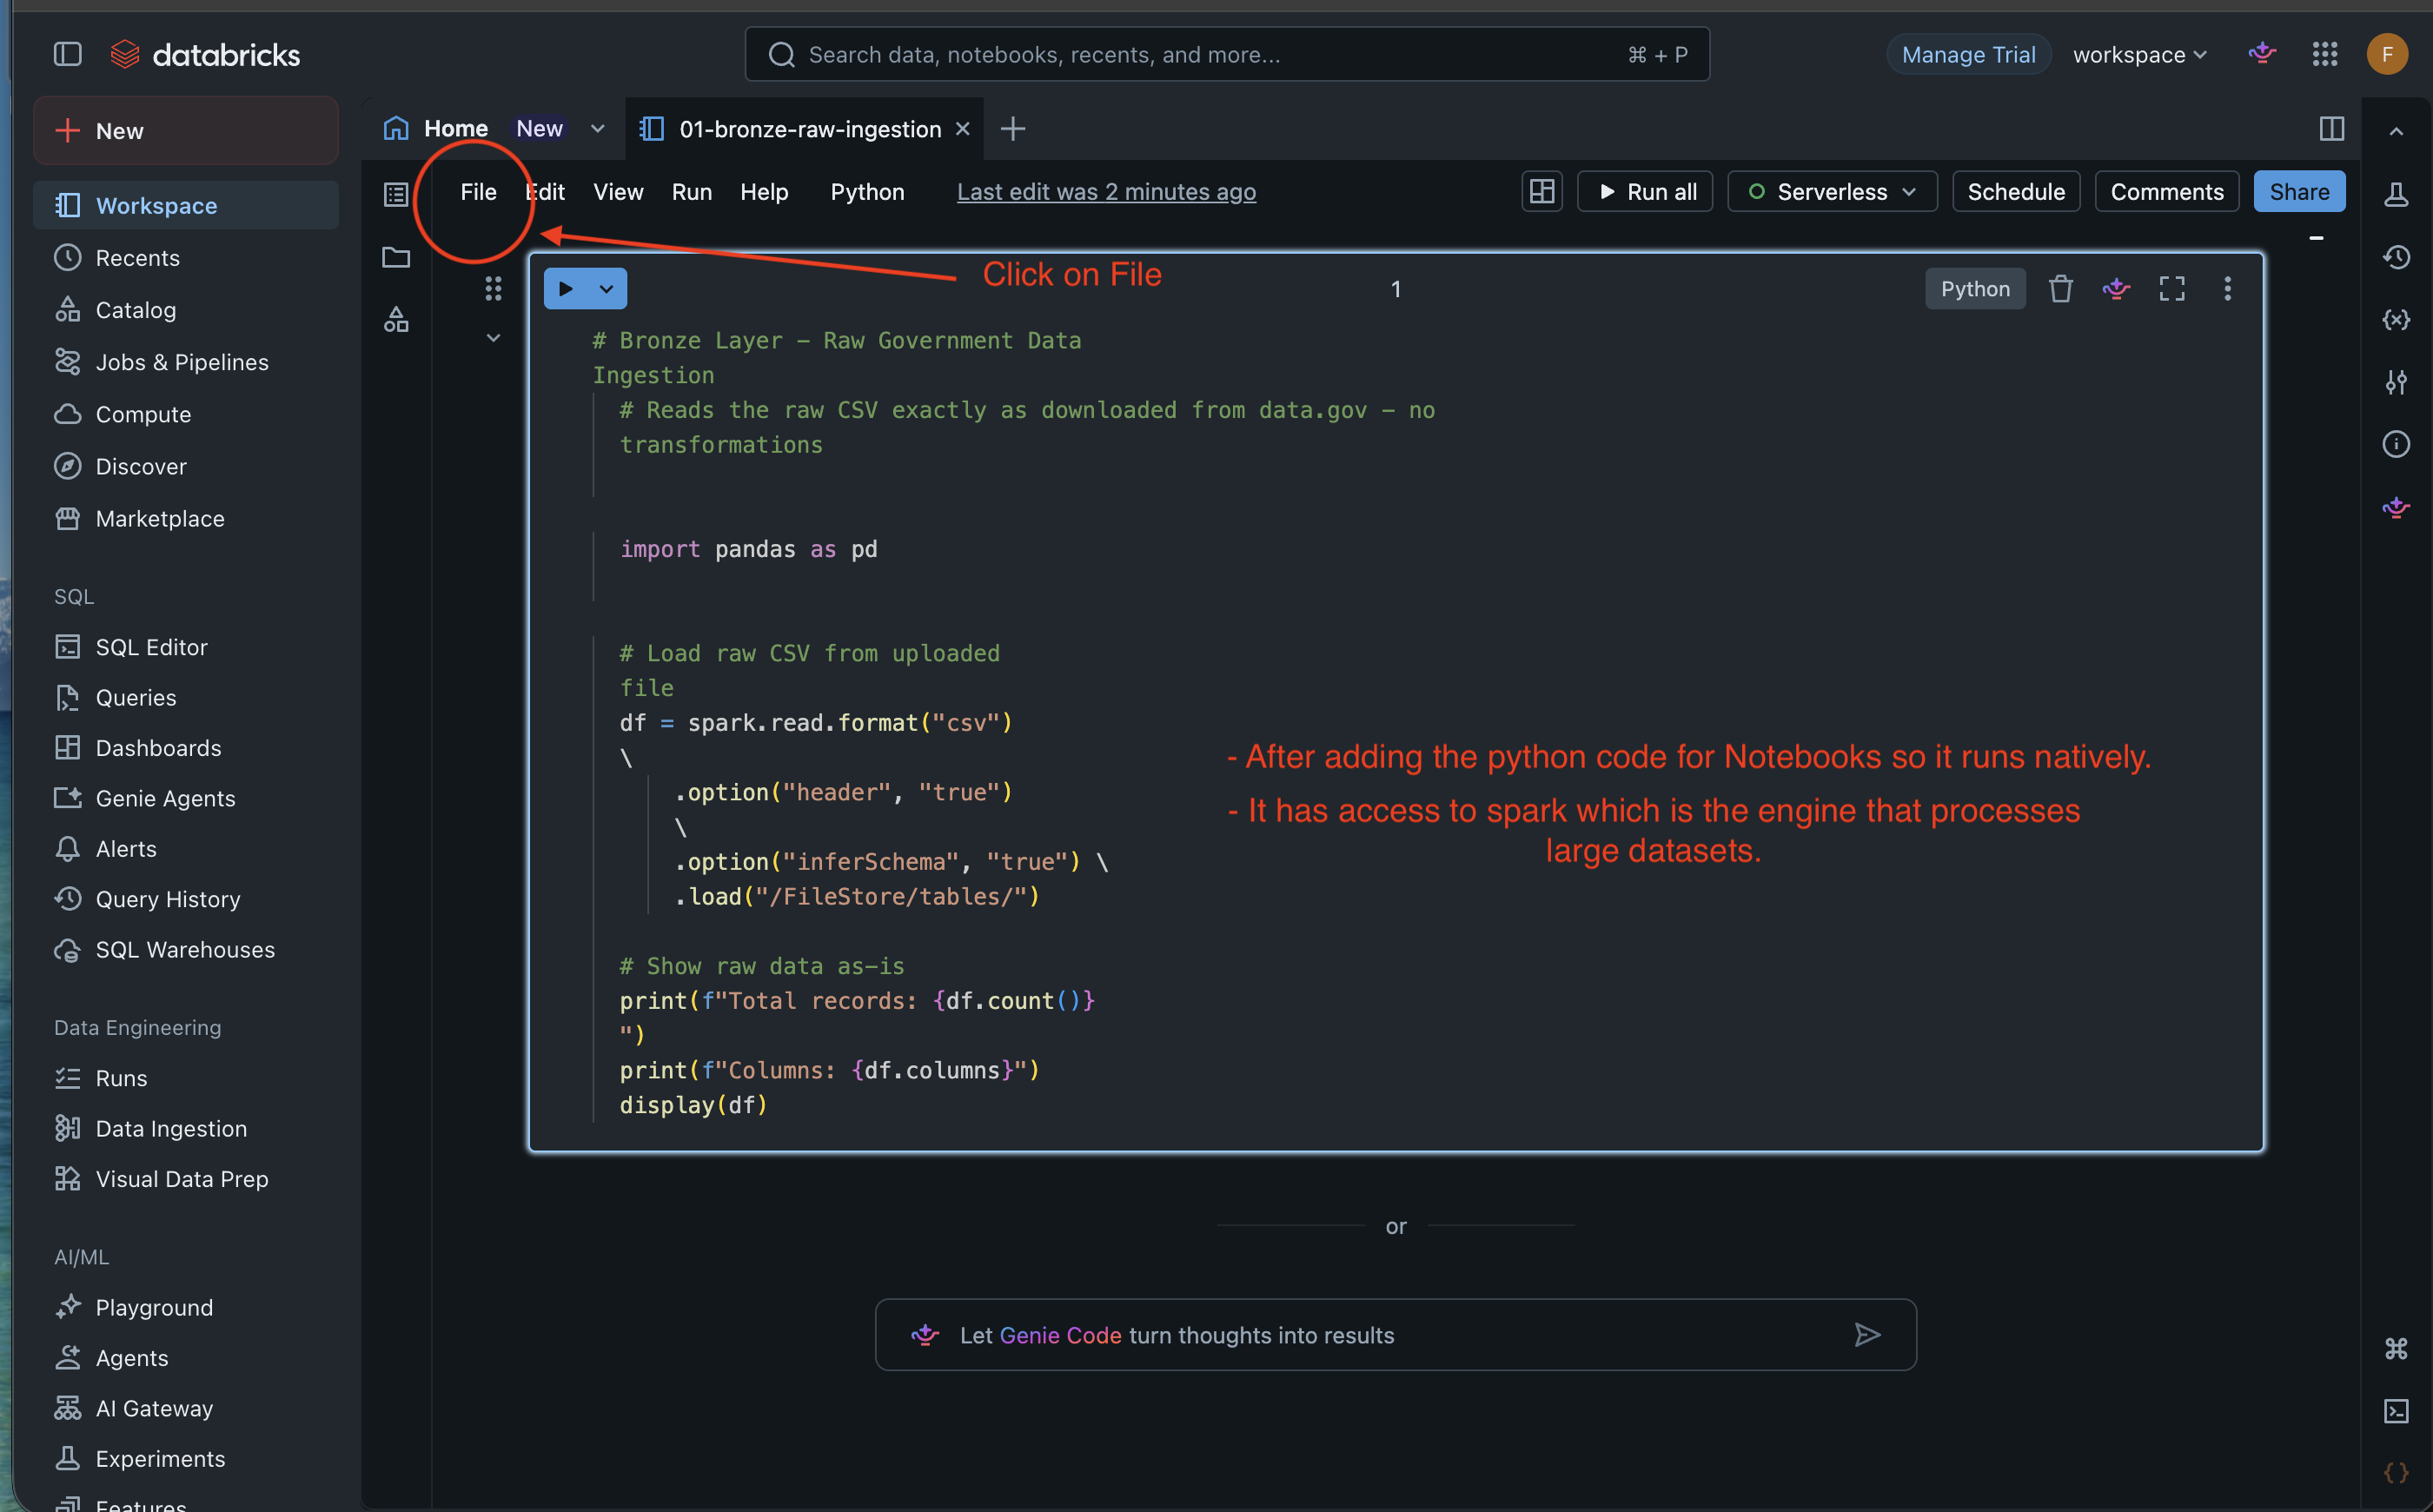
Now we replace the previous python code for this one:
# Bronze Layer - Raw Government Data Ingestion
df = spark.read.format("csv").option("header", "true").option("inferSchema",
"true").load("/Volumes/govt_data_pipeline/default/bronze_raw_data/export.csv")
print(f"Total records: {df.count()}")
print(f"Columns: {df.columns}")
display(df)
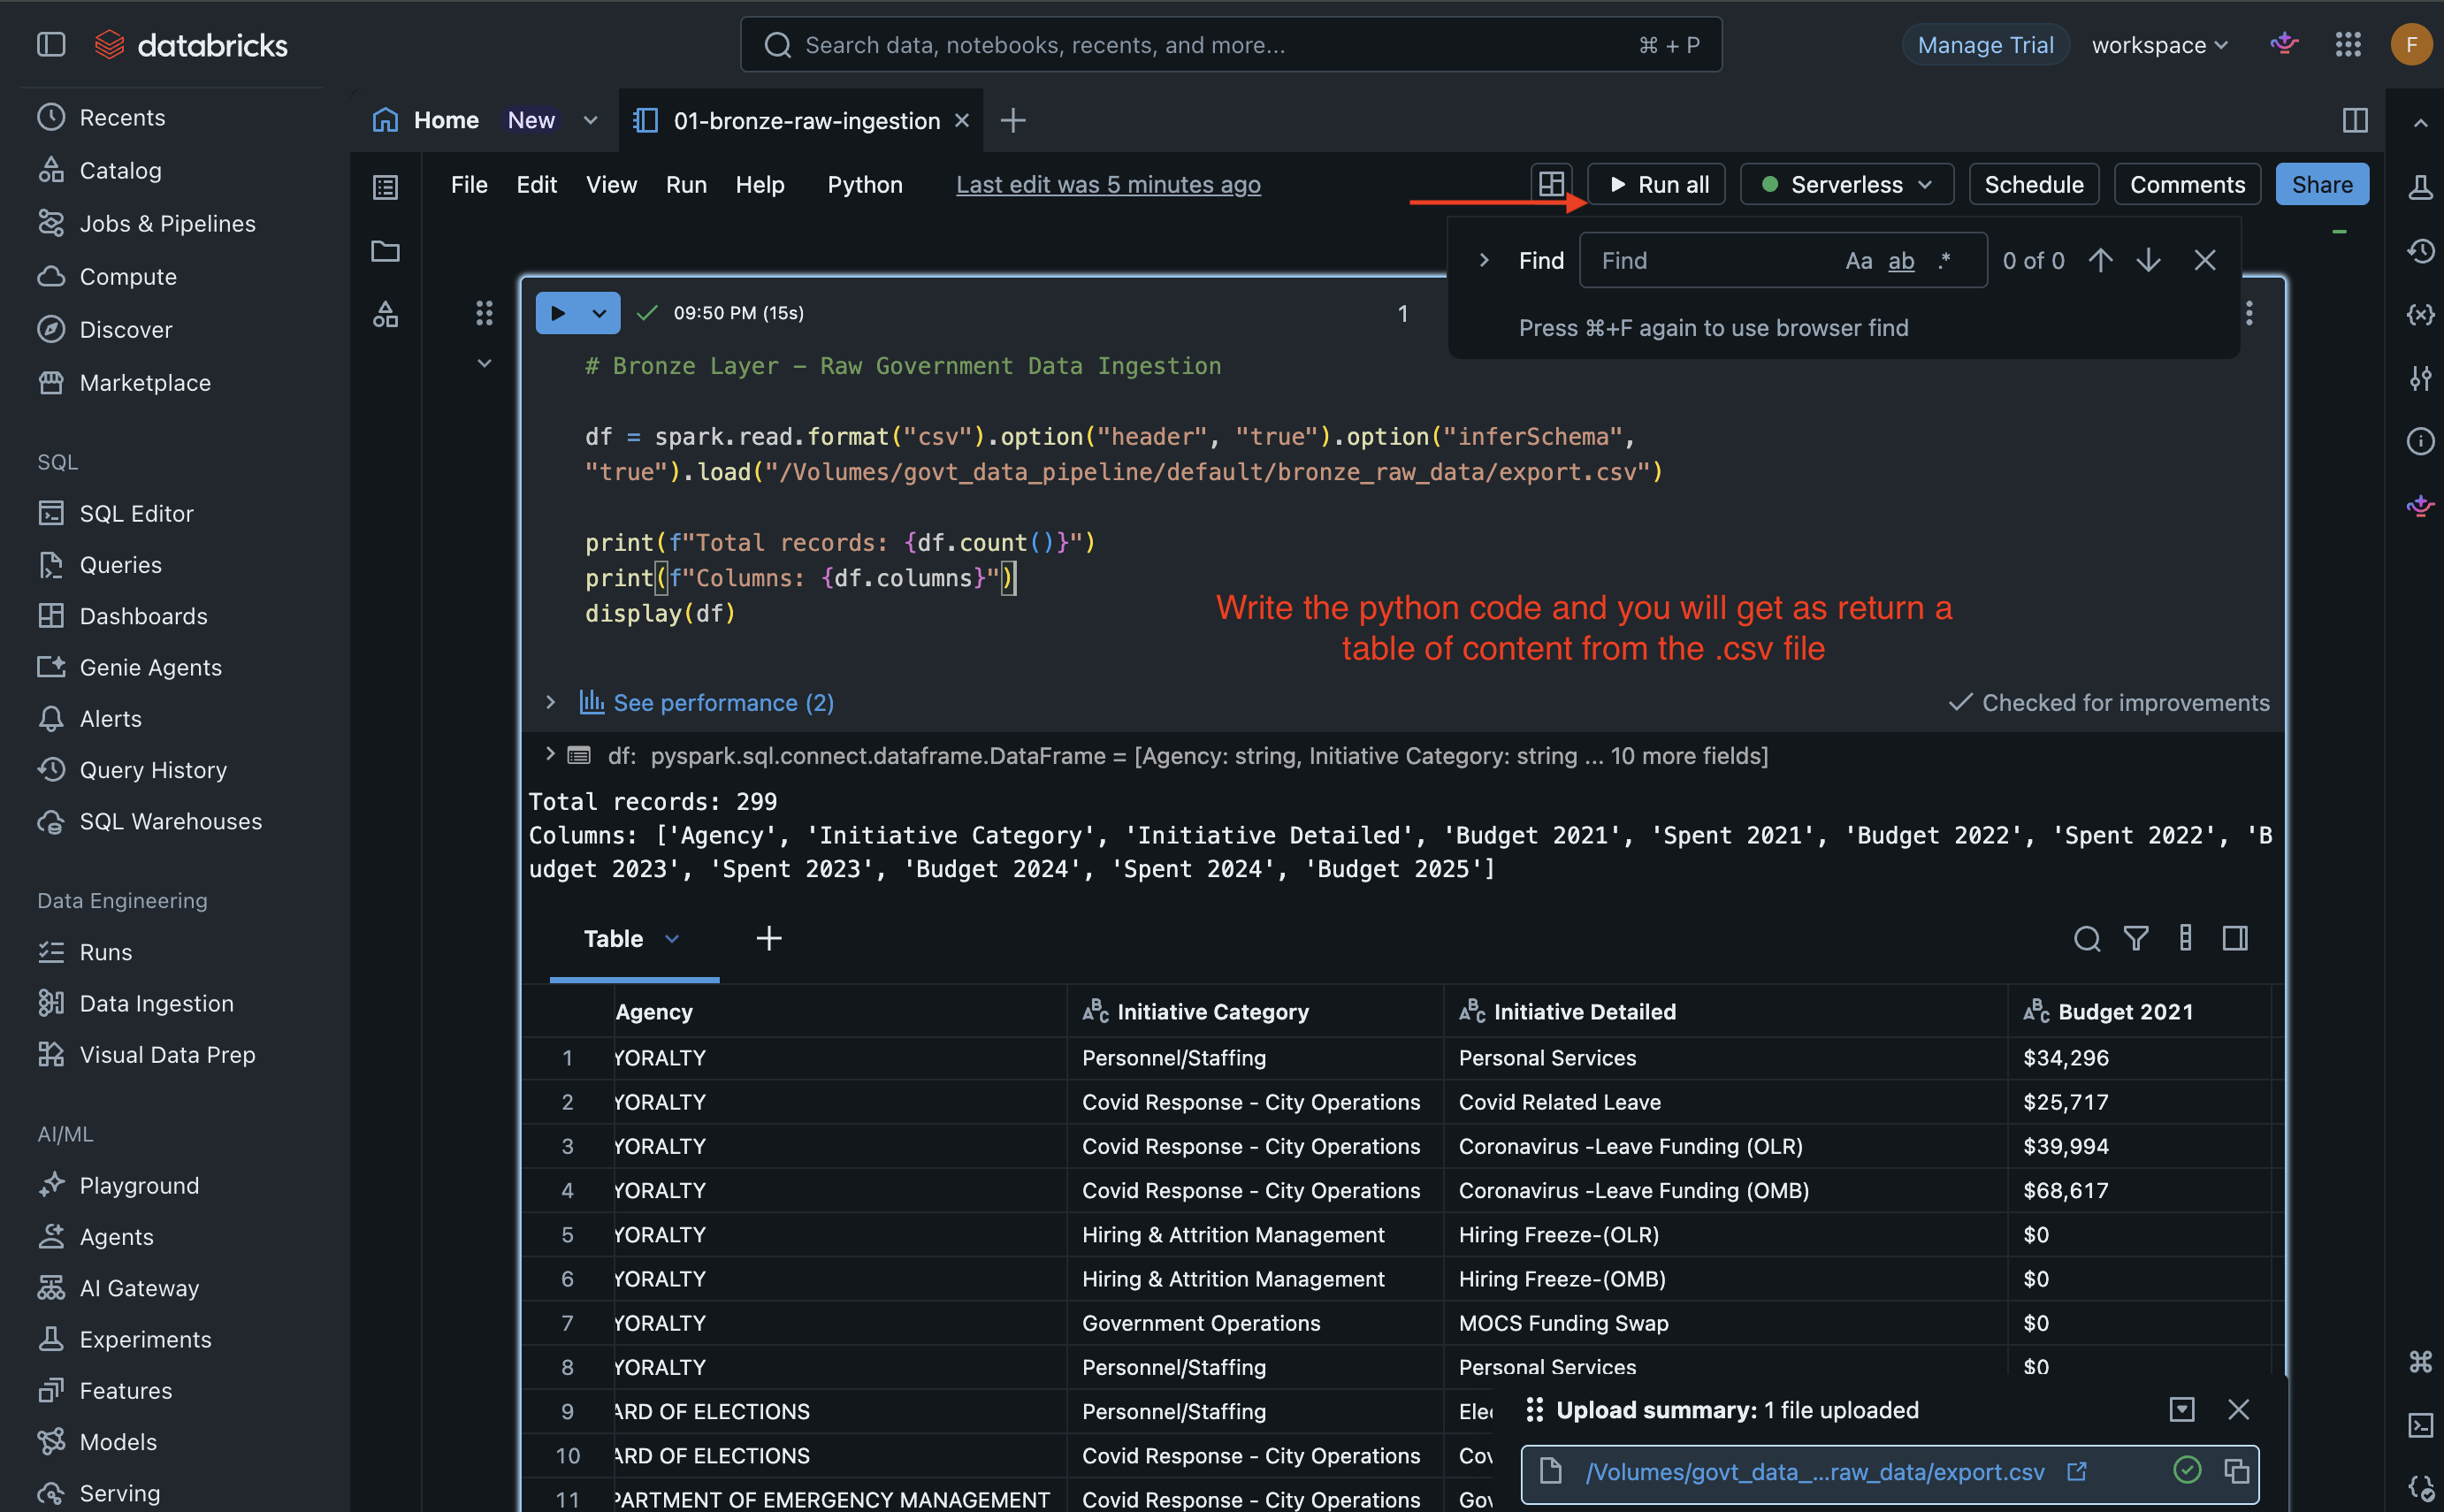
- Bronze notebook successfully ingested 299 records from the raw government CSV
- Data is displayed exactly as downloaded from data.gov - raw, unmodified
- Running on Serverless compute in Databricks with 15 second runtime
- This is the Bronze layer of the medallion architecture - raw ingestion, no transformations applied
- Data is stored in Unity Catalog volume govt_data_pipeline.default.bronze_raw_data
Make sure to click on the "+" sign button to create a new Notebook and name it 02-silver-cleaned-data
For Silver run the code:
# Silver Layer - Cleaned and Standardized Data
df_bronze = spark.read.format("csv").option("header", "true").option("inferSchema",
"true").load("/Volumes/govt_data_pipeline/default/bronze_raw_data/export.csv")
from pyspark.sql.functions import col, trim
from pyspark.sql import functions as F
df_silver = df_bronze.dropna(how="all").select([trim(col(c)).alias(c.strip().lower().replace(" ", "_")) for c in df_bronze.columns])
print(f"Bronze records: {df_bronze.count()}")
print(f"Silver records after cleaning: {df_silver.count()}")
print(f"Columns: {df_silver.columns}")
display(df_silver)
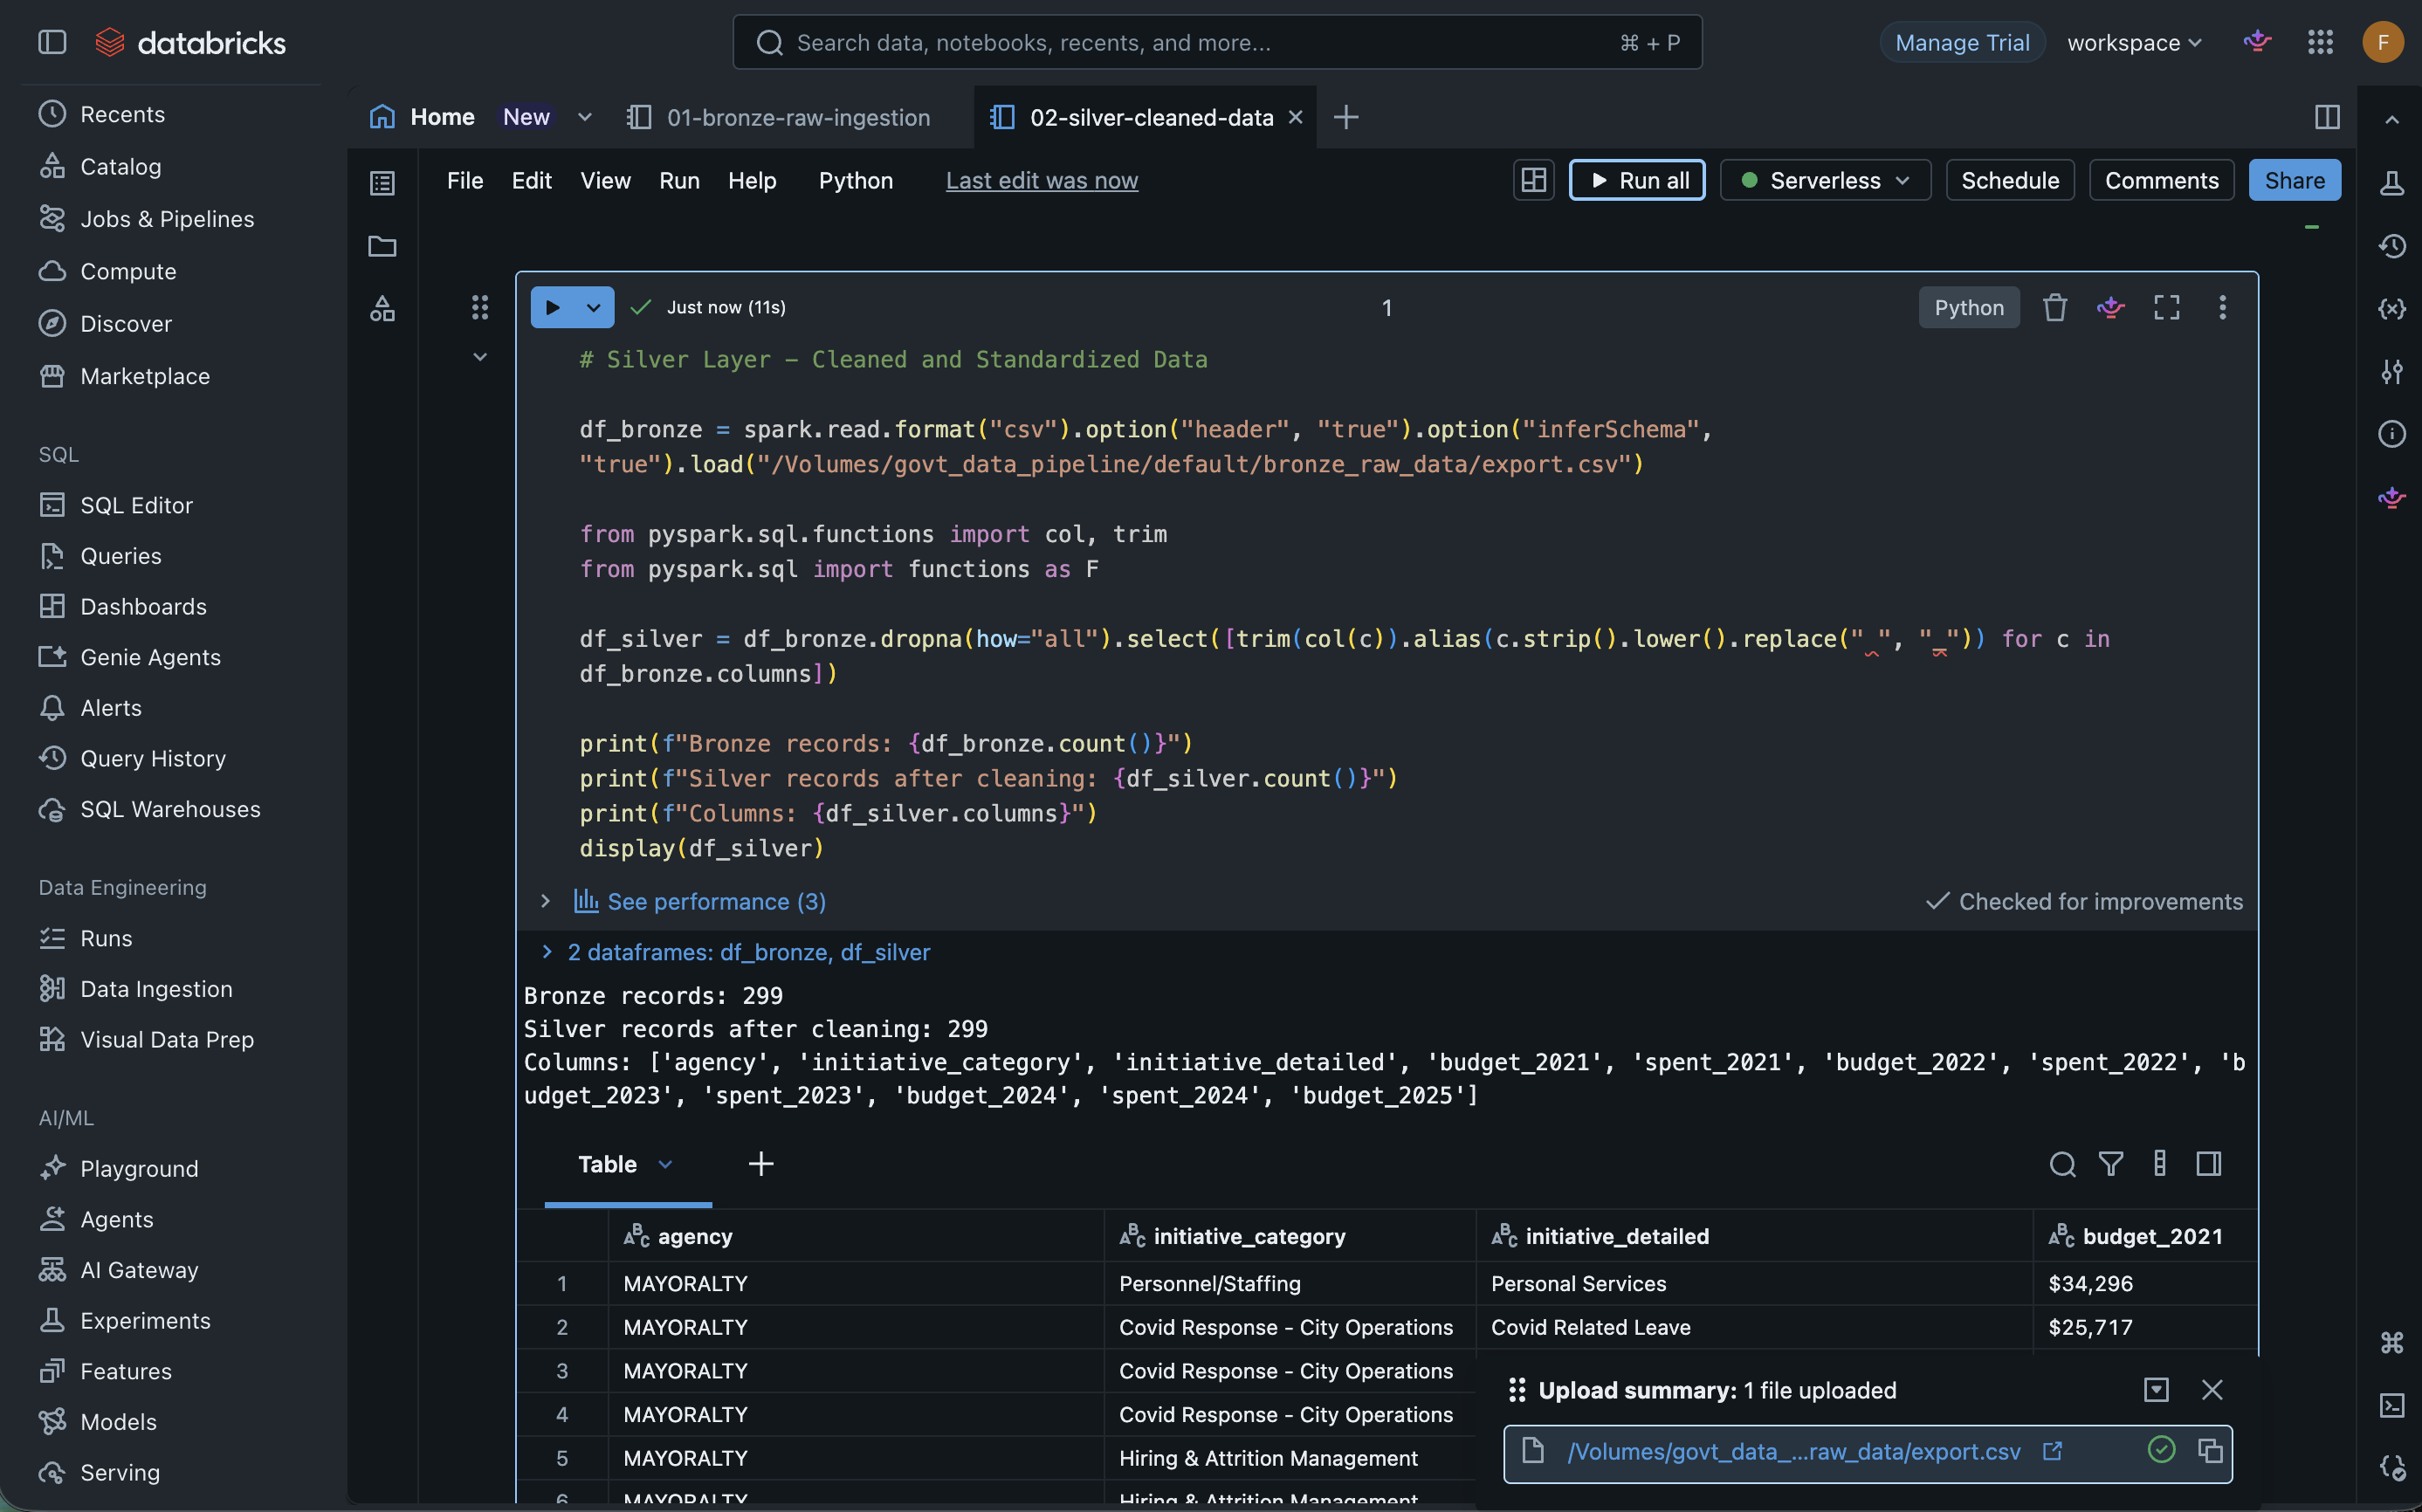
- Silver layer cleans and standardizes the raw Bronze data
- Column names converted to lowercase with underscores - standard naming convention for data platforms
- Whitespace trimmed from all string fields using trim()
- Record count comparison between Bronze and Silver confirms data quality check passed
- This transformation makes the data query-ready for the Gold aggregation layer
Click on the plus sign button and name it 03-gold-aggregated
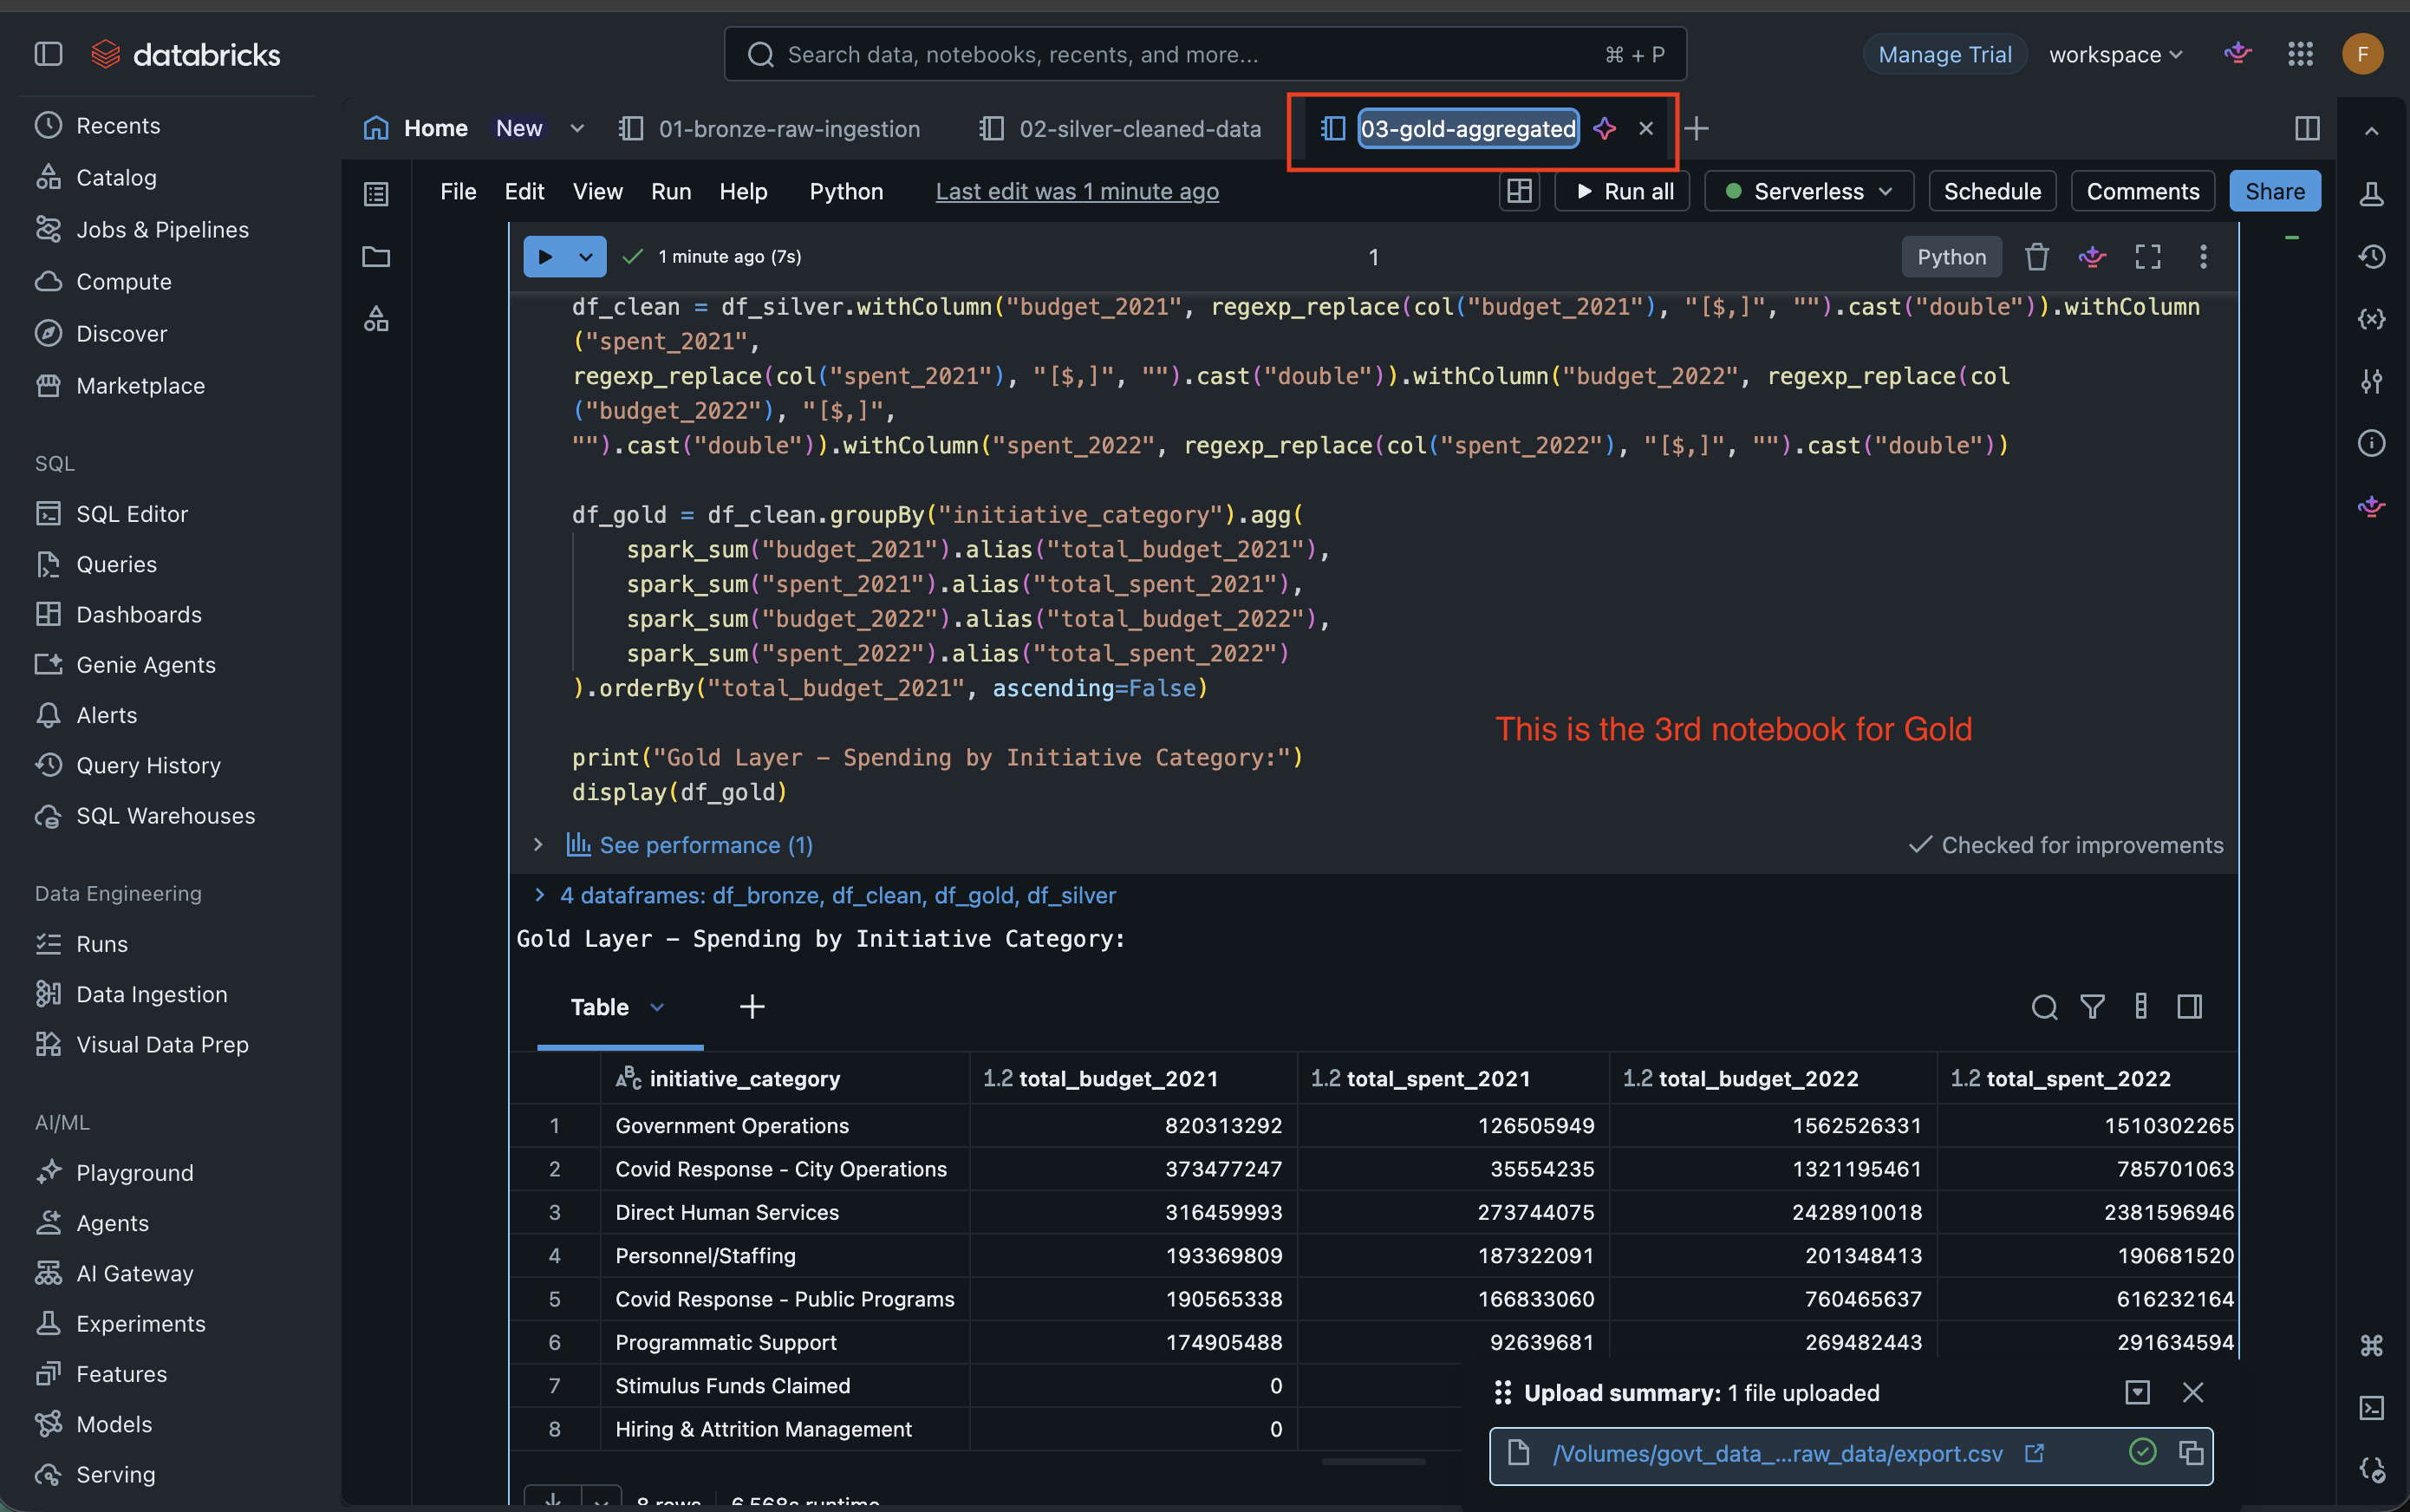
- Gold layer aggregates spending data by Initiative Category across multiple years
- Dollar signs and commas stripped from budget columns using regexp_replace before numeric aggregation
- Data grouped and ordered by total budget which is the highest spending categories first
- This is the analytics ready layer of the medallion architecture which is structured for reporting and dashboards
Bronze keeps the data exactly as it came from the government, Silver cleans it up by removing junk (for example: dollar signs, commas, extra spaces, and empty rows) and standardizing the format, and Gold crunches the numbers into a summary that answers real business questions like "which agency spent the most?"
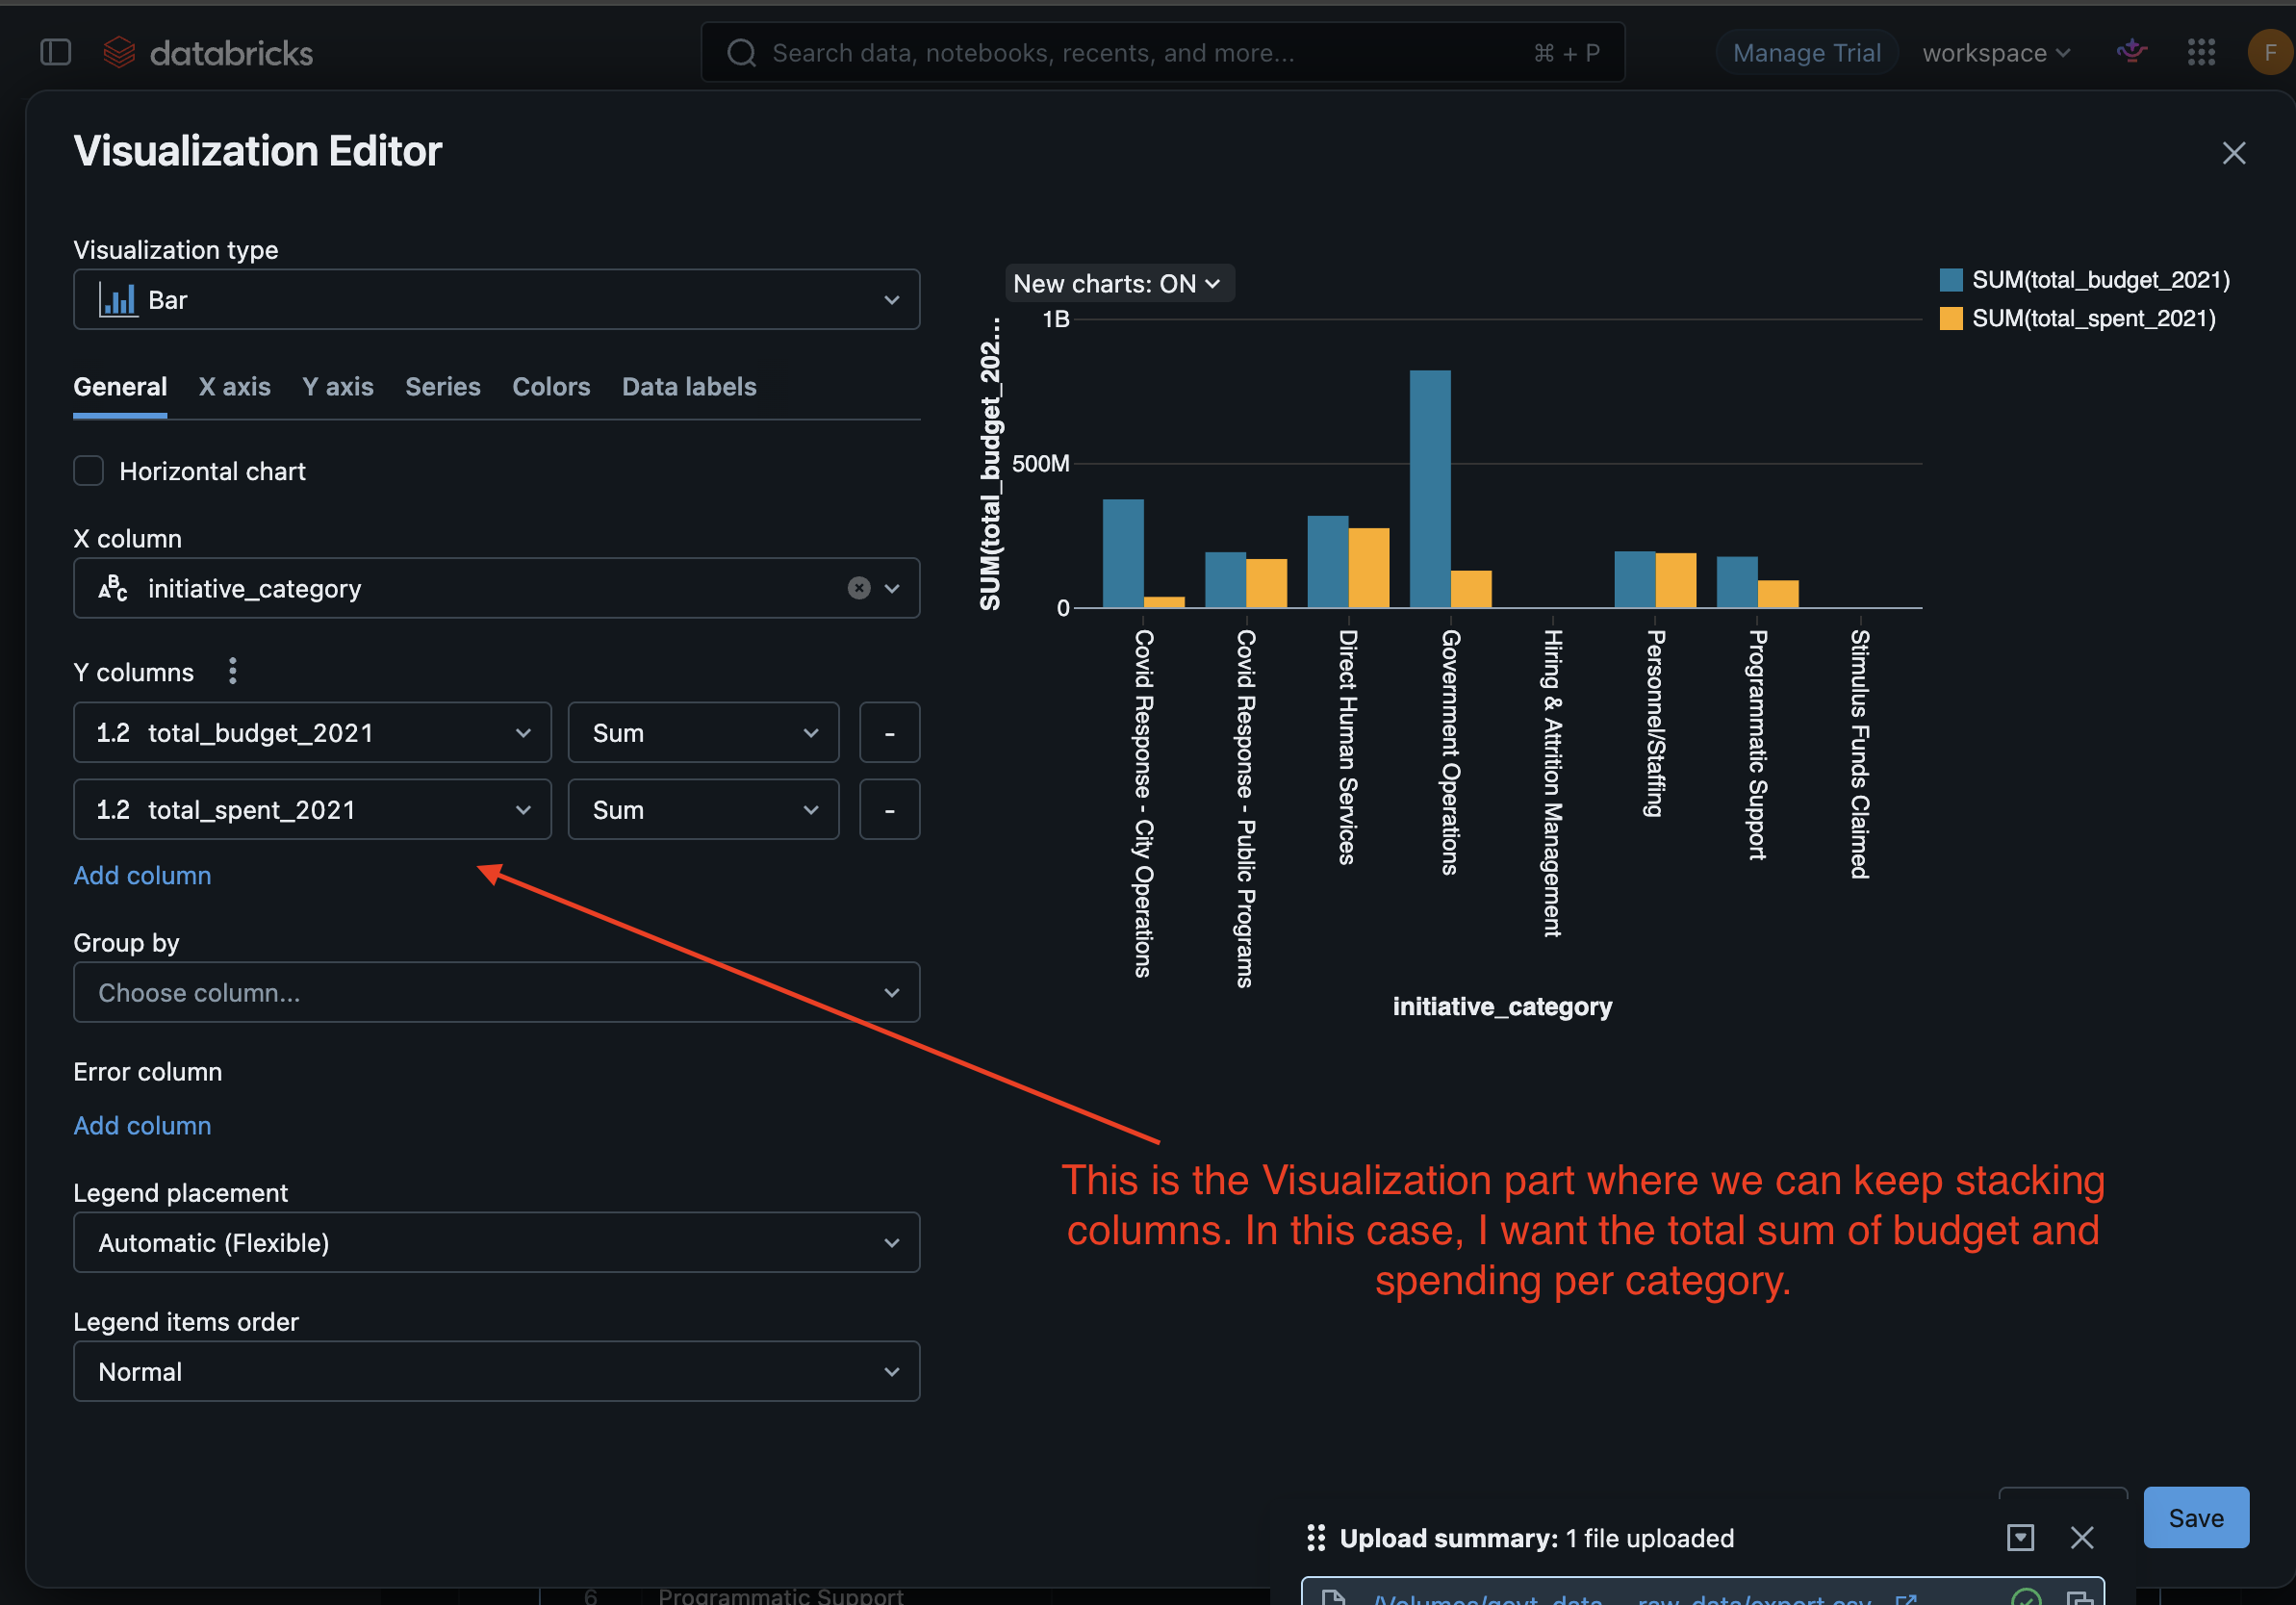
Click the "+" button next to the "Table" column. This will take us to Visualizations.
For this example, I want total sum of budget and spending per category.
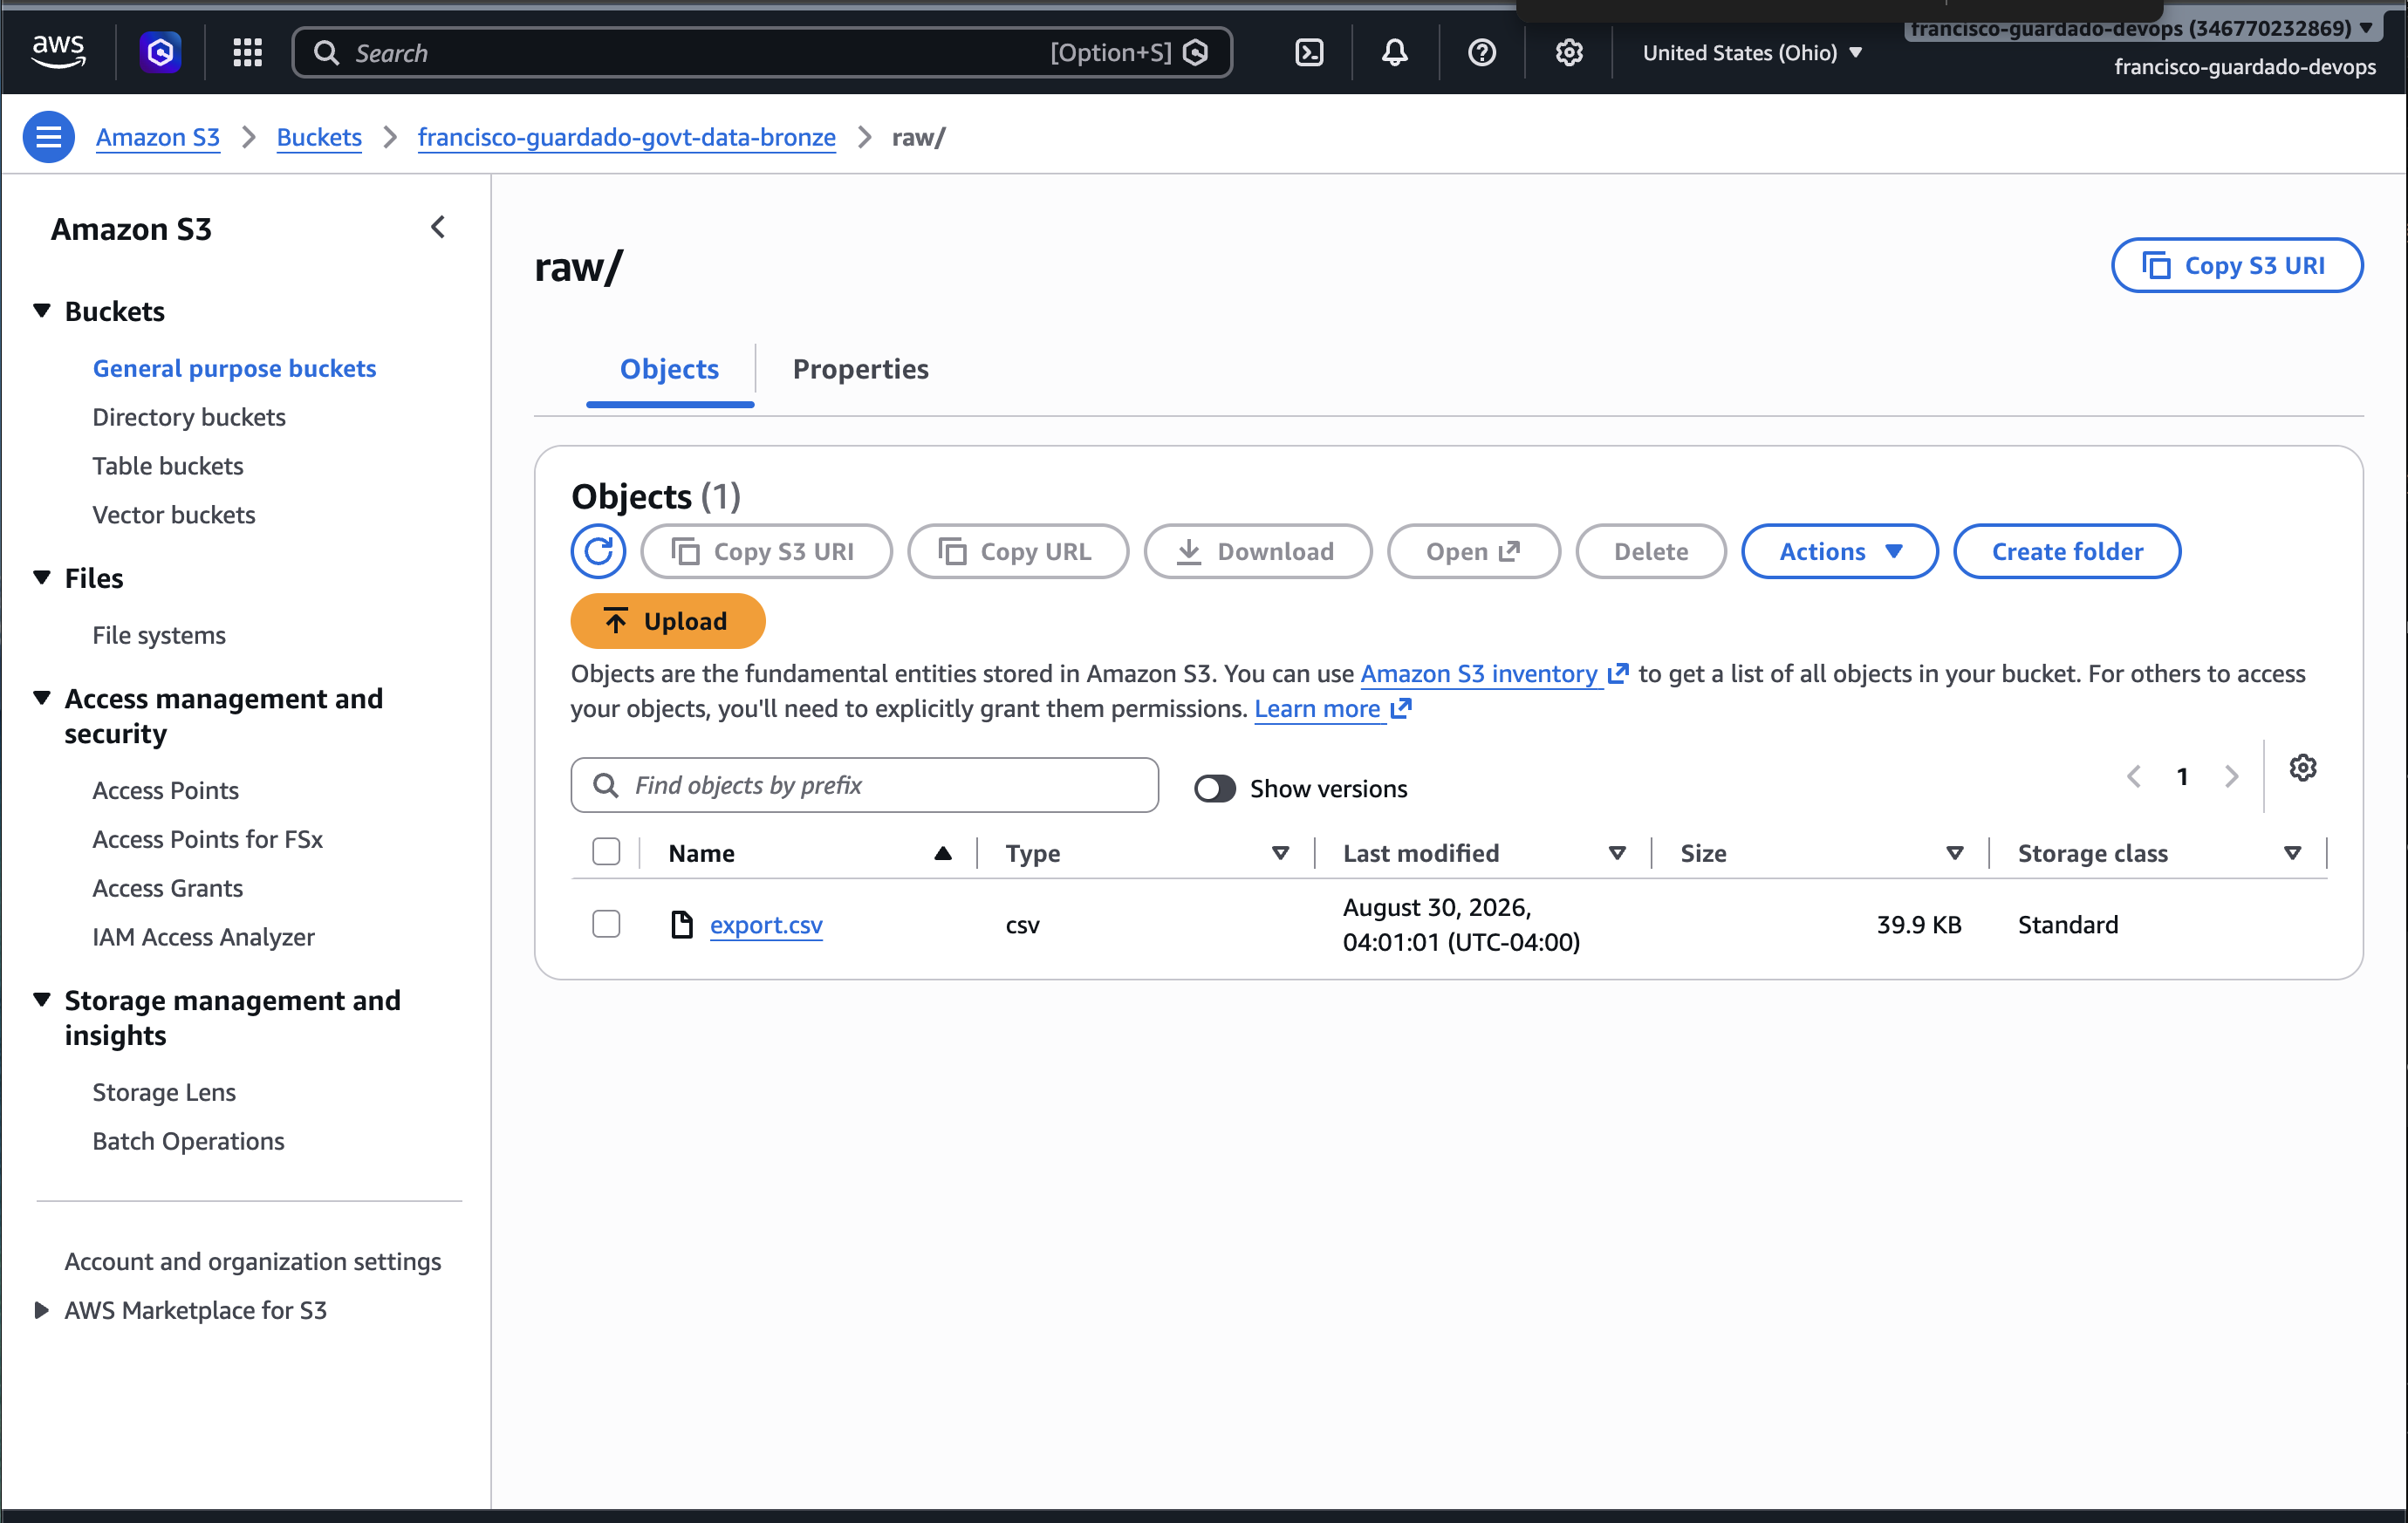
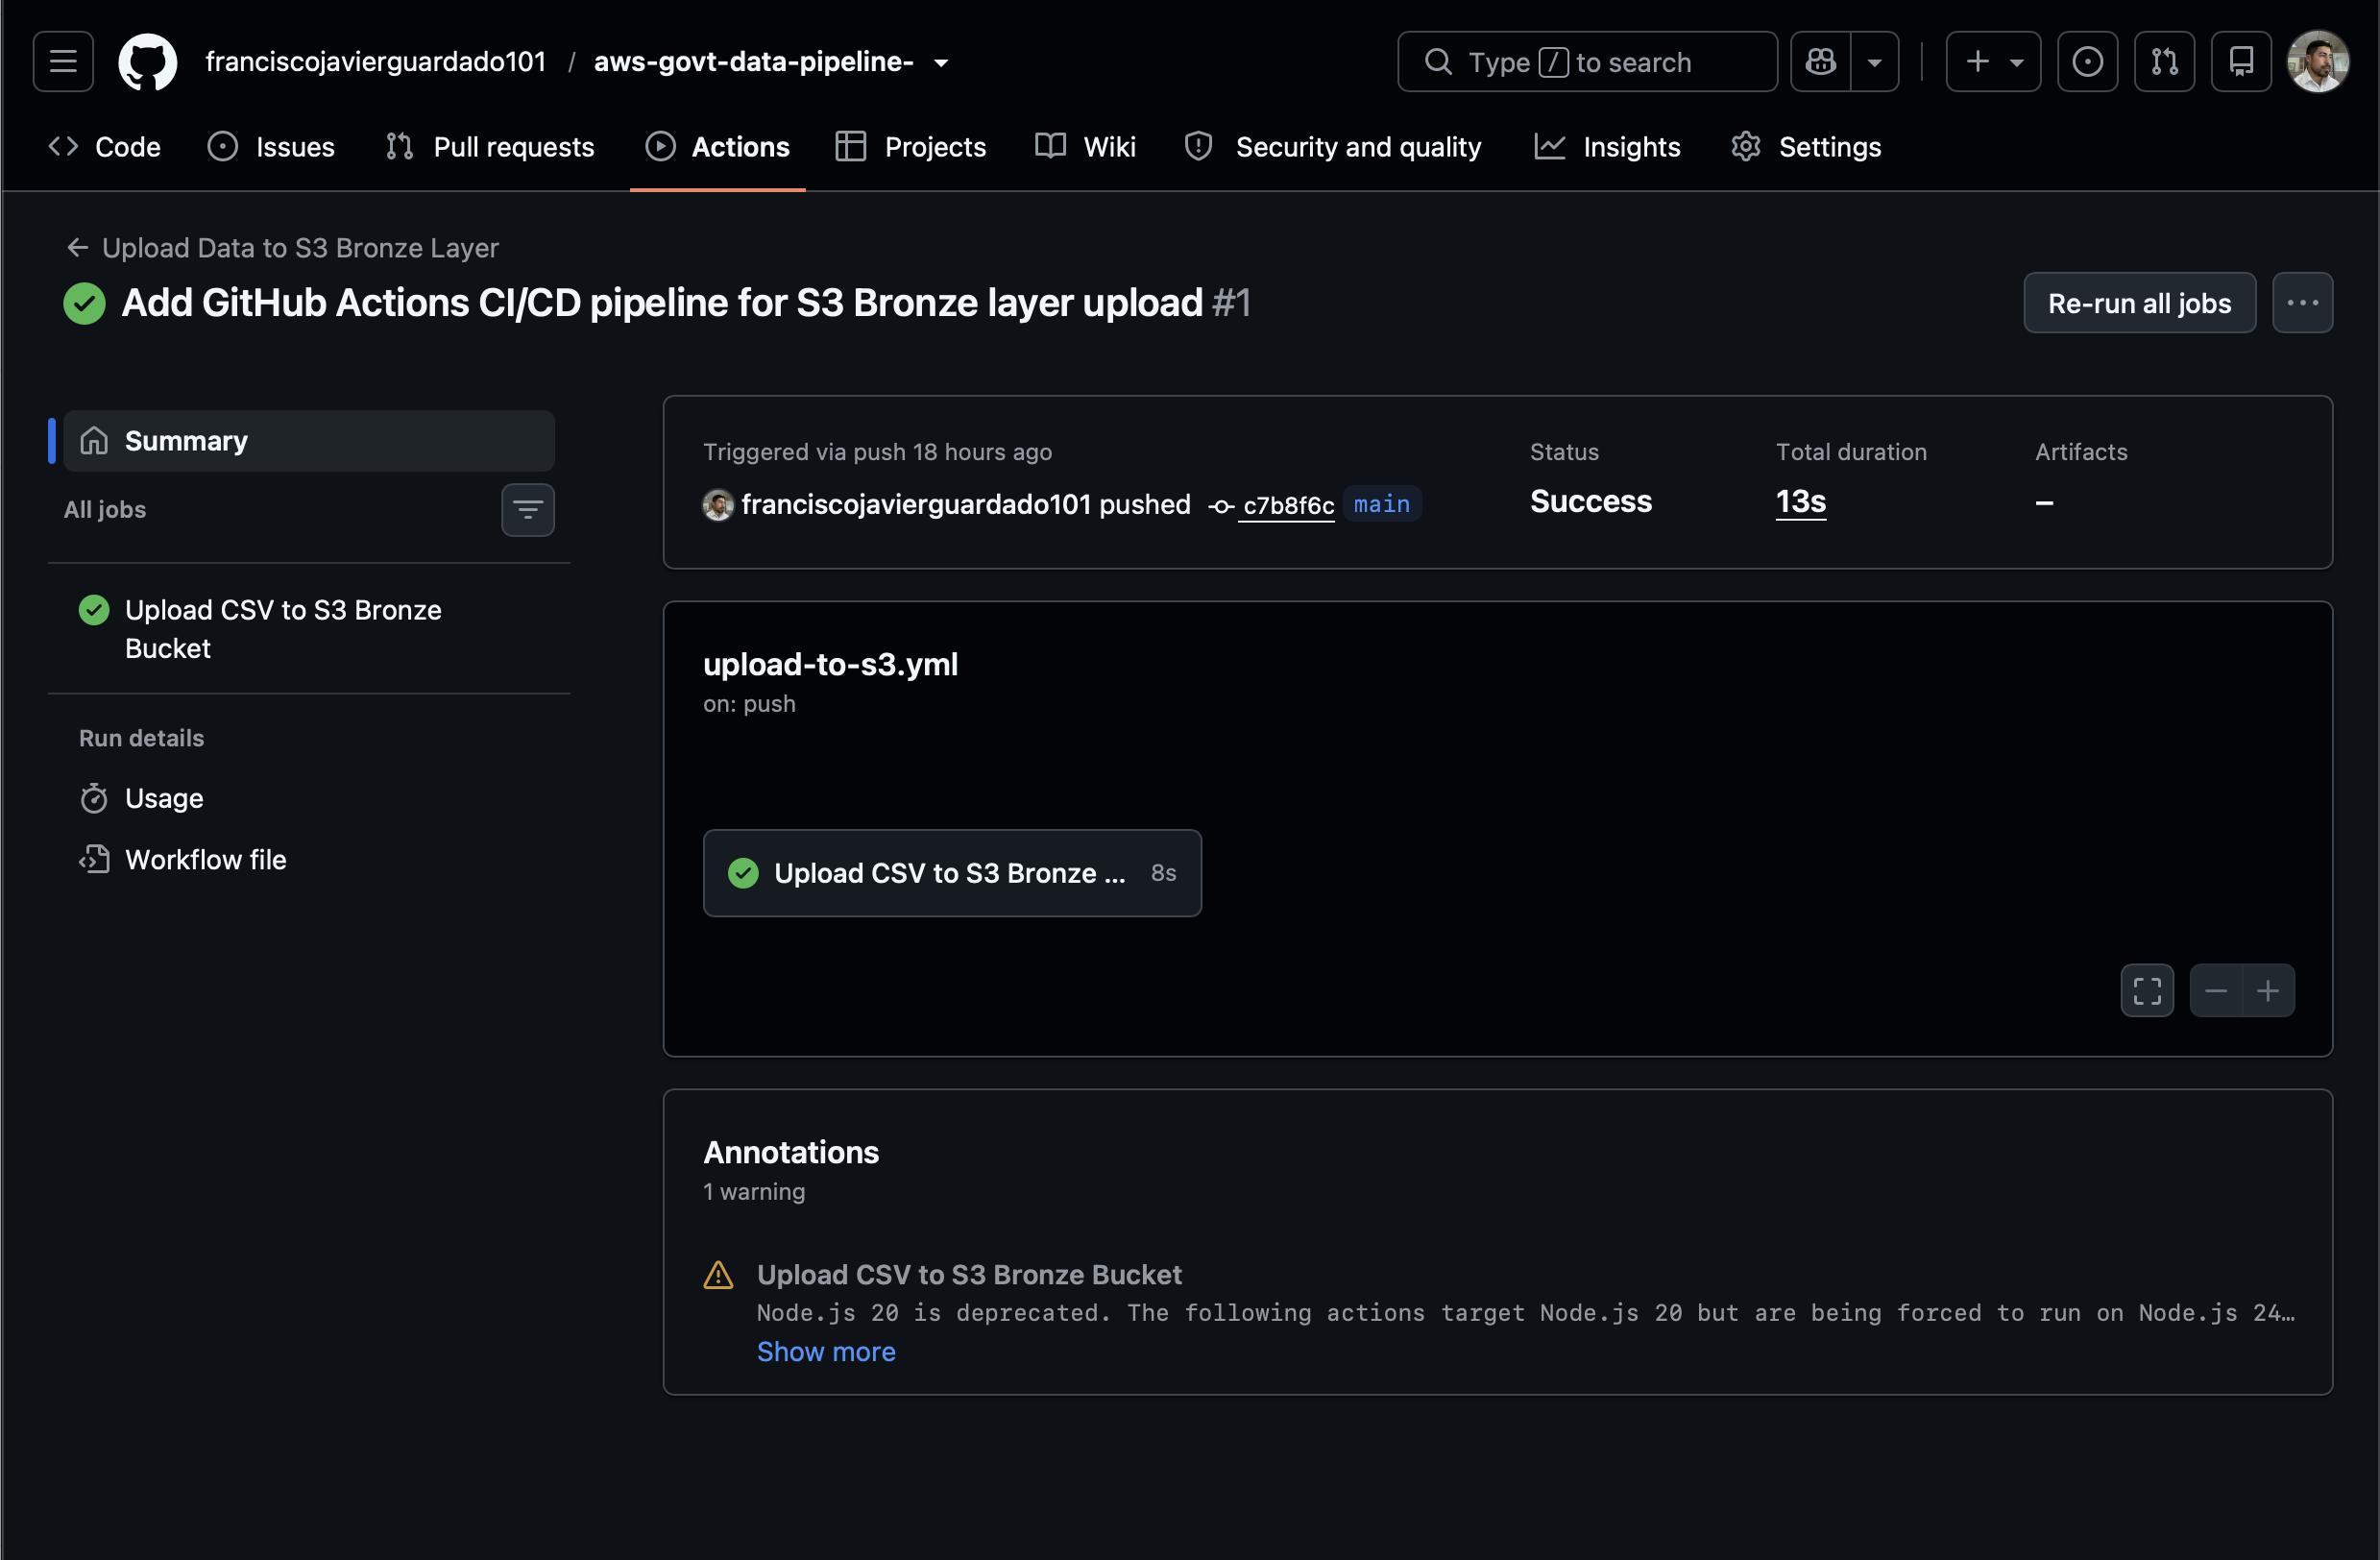
The S3 Bronze bucket (francisco-guardado-govt-data-bronze) contains the raw government dataset. The raw/ folder was created automatically by the GitHub Actions pipeline when it ran for the first time. This is the Bronze layer of the medallion architecture. The raw data lands here exactly as is, untransformed.